.svg)
GiAPA Intro Video




Management Graphics
GiAPA offers a wide range of charts that gives an overview at a glance. The charts are generated by RPG programs running on the server - no installation needed on the PC.
The charts can be scheduled to run in unattended batch and optionally sent attached to an Email to one or more receivers.
With data available for all resources and all jobs every 15 seconds, the possibilities are infinite.
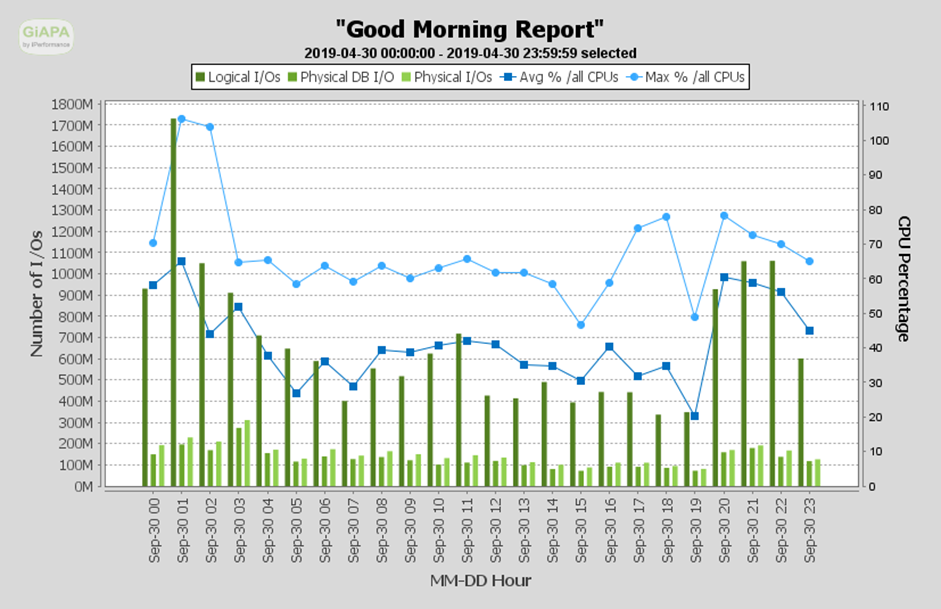
GiAPA charts can be copied to the clipboard, and the source data can be exported to Excel for further processing.

Overview over the total CPU usage per hour for all LPARs on a server
.png)
Who used the most CPU? Below charts shows the nn jobs, and jobs with user names consuming the most resources.
.jpg)
GiAPA News & Tips
.png)
© 2024 Crowdyflow Agency powered by Webflow