June 14, 2025
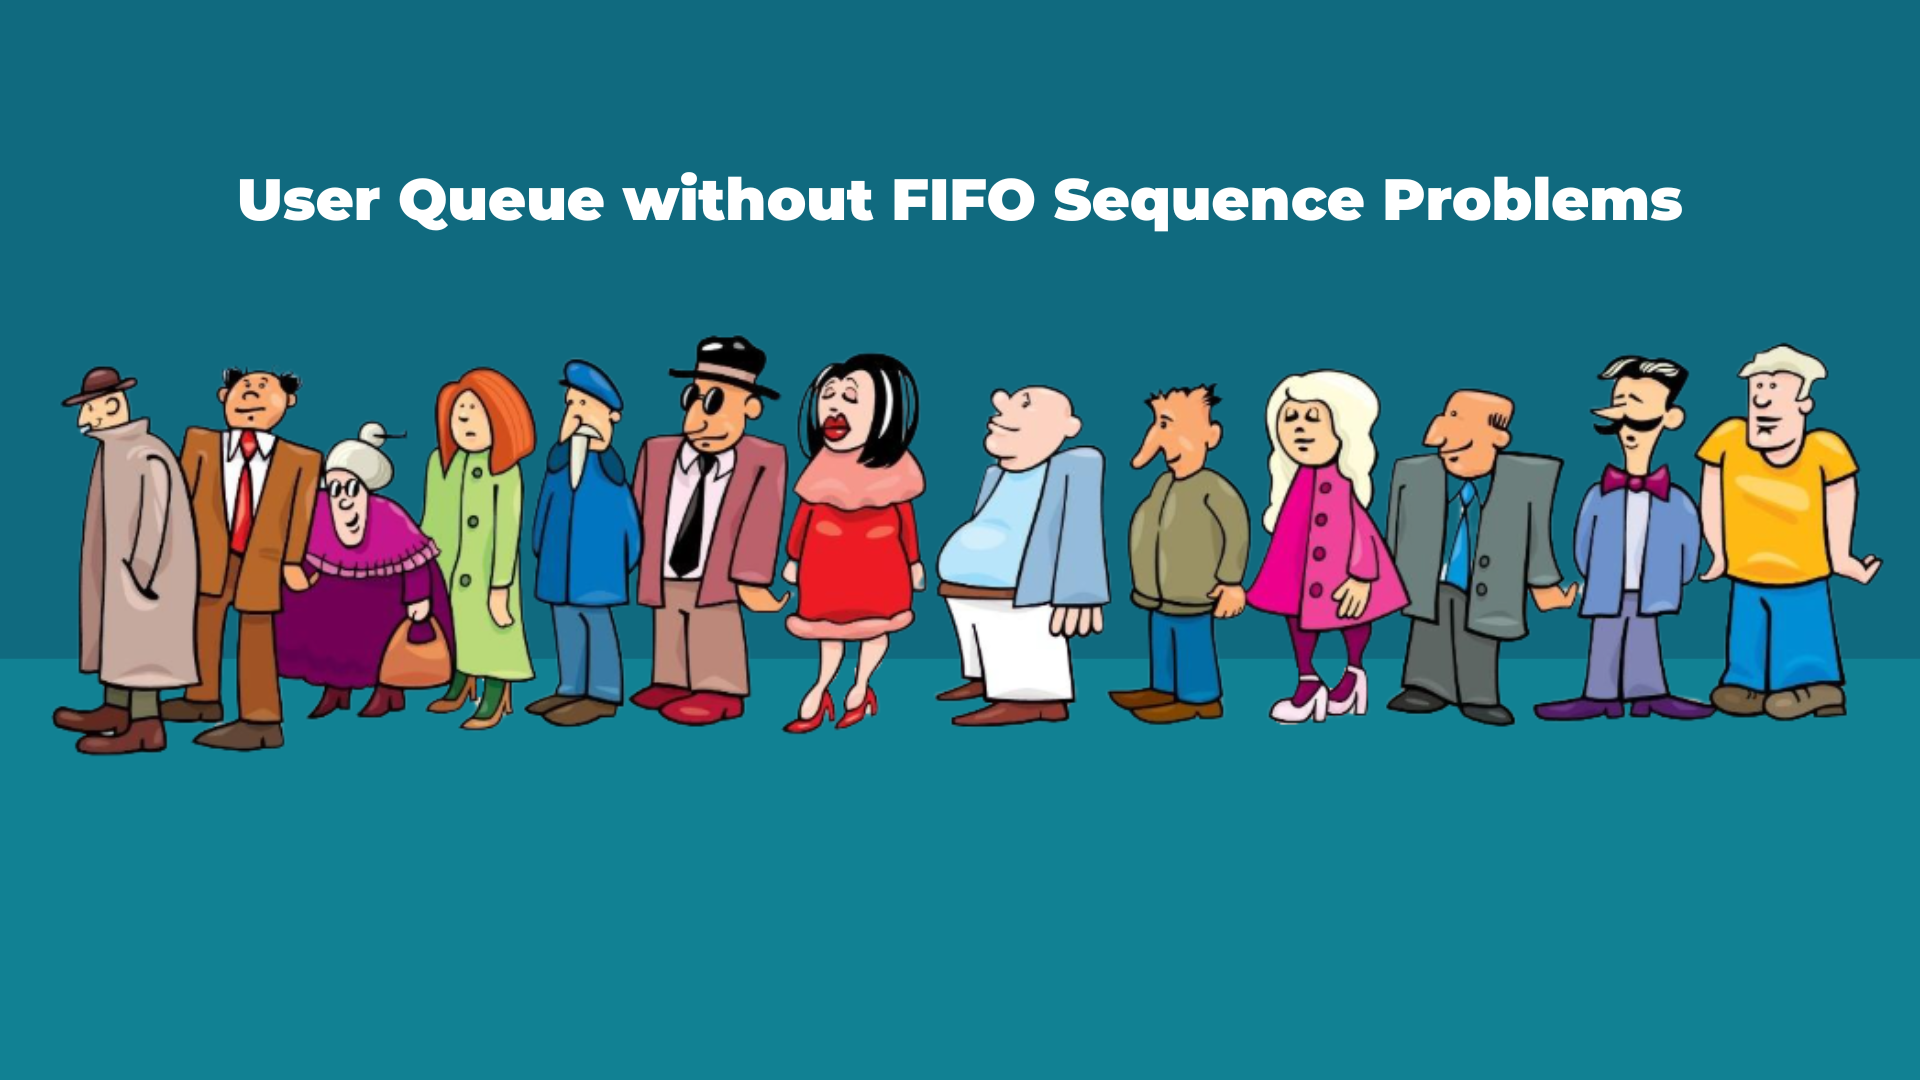
Why FIFO isn’t Always FIFO: Lessons from User Queues on Power i
This is some text inside of a div block.


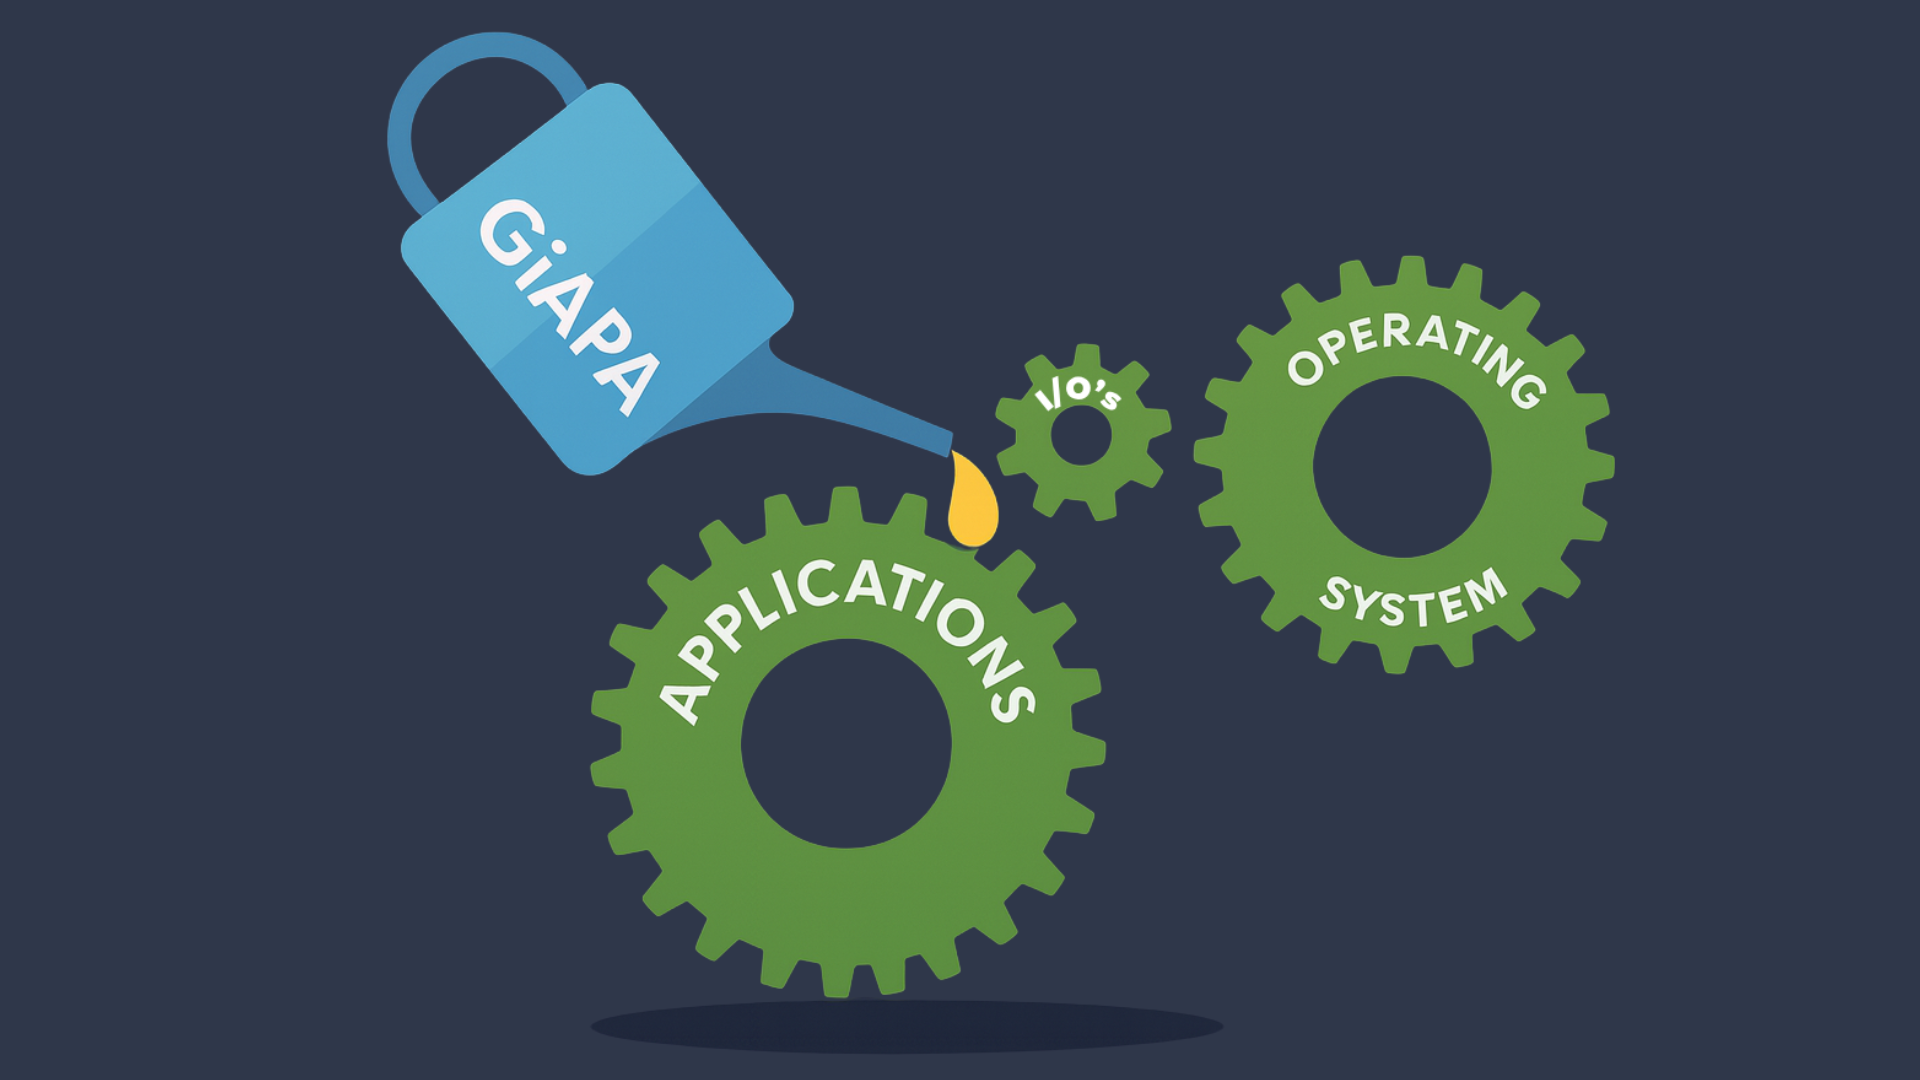
GiAPA is a performance analysis and operations tool for IBM Power i.
It collects system data continuously and turns it into actionable insight
– without slowing the system down.
.png)
GiAPA started with a simple idea: IBM i users deserve better tools to understand how their systems are performing. With decades of hands-on experience, we’ve built a solution that gives you full visibility into jobs and system load – without adding complexity.
Start for free

.svg)
.png)
In this section, you'll find in-depth articles, practical tips, and real-world experiences aimed at helping system administrators and IT decision-makers improve performance, reduce resource usage, and get more value from their IBM i environments. Whether you're exploring general best practices or diving into specific GiAPA capabilities, our insights are here to guide you. Explore, learn, and optimize.