June 14, 2025
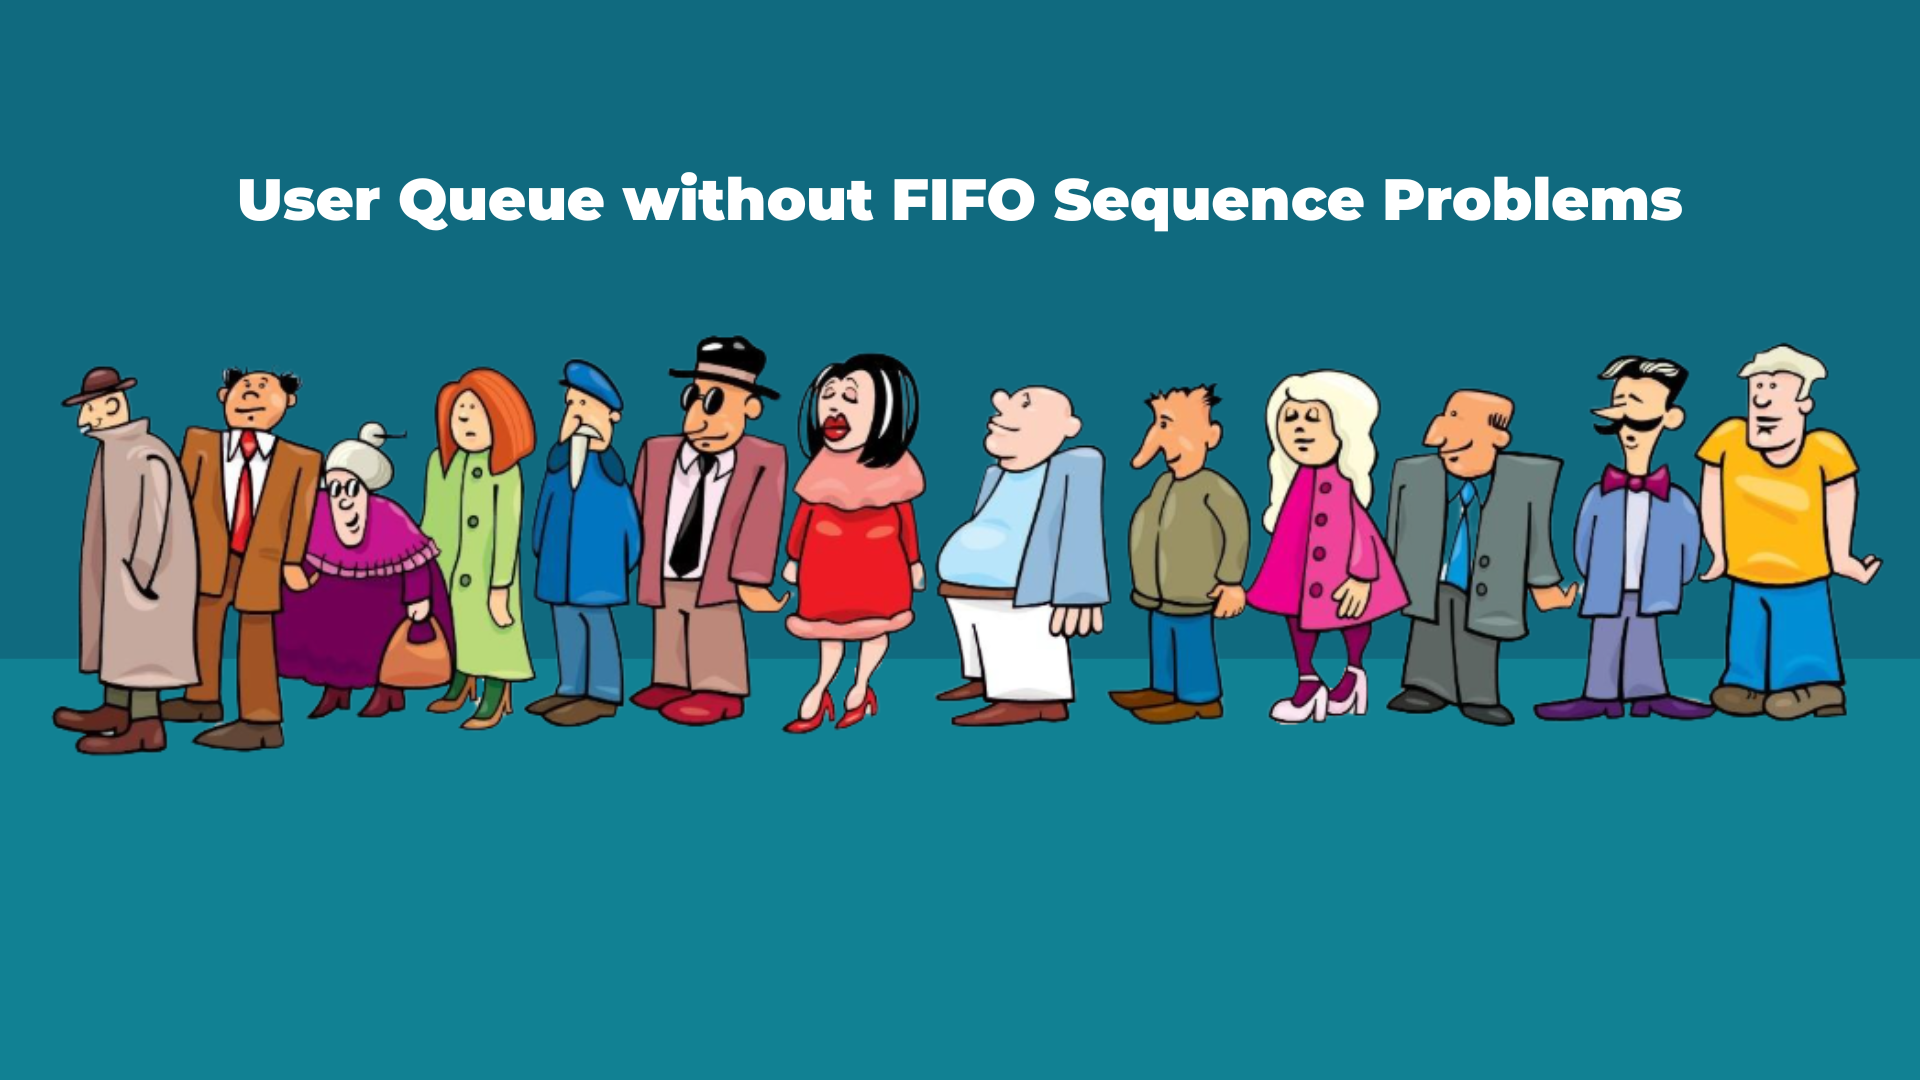
Why FIFO isn’t Always FIFO: Lessons from User Queues on Power i
This is some text inside of a div block.


You might think that monitoring system performance means adding more load to your system. That’s a reasonable concern – and a common reason why performance tools are often used only in emergencies.
But that’s exactly what I wanted to avoid when developing GiAPA.
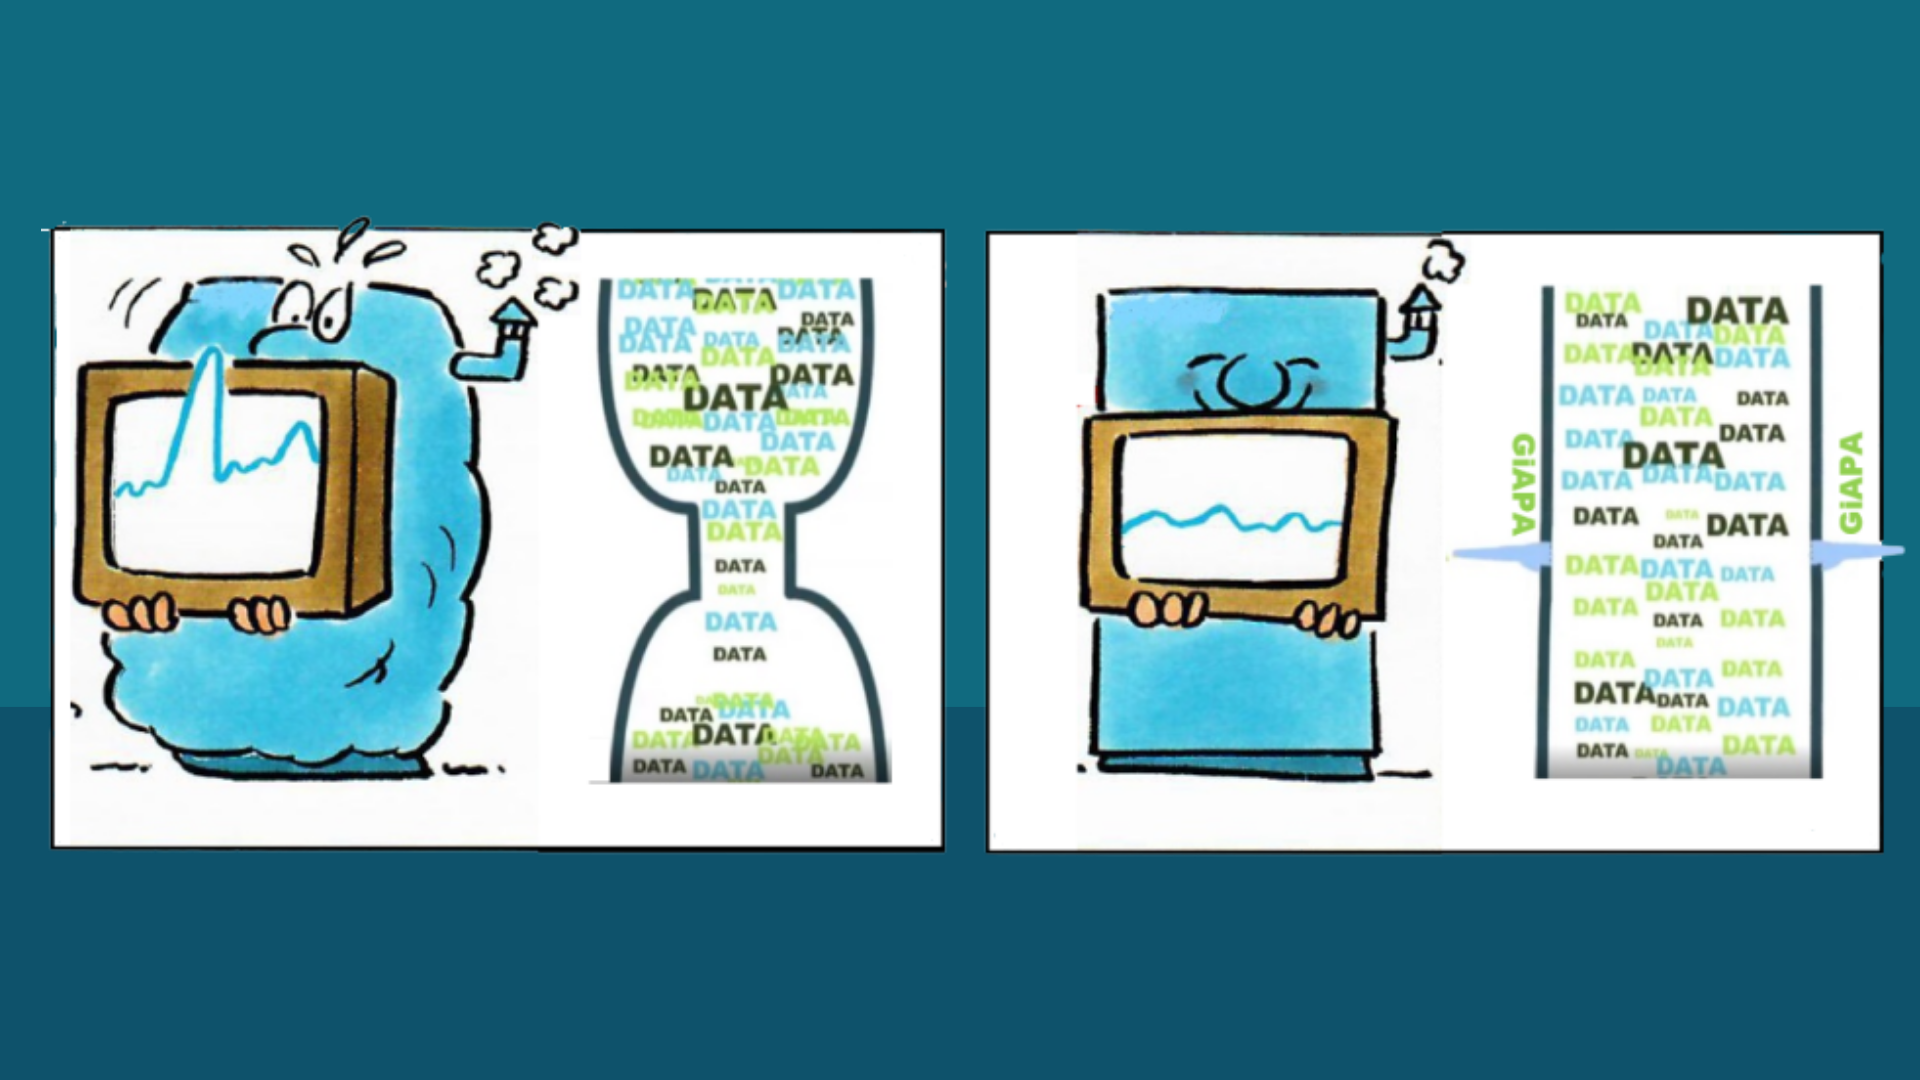
GiAPA is designed to run continuously in the background, quietly collecting performance data without disturbing the system it monitors. In most environments, the CPU load from GiAPA stays below 0.1%. That means you can keep it running around the clock – and still sleep soundly.
GiAPA gathers a wide range of performance metrics:
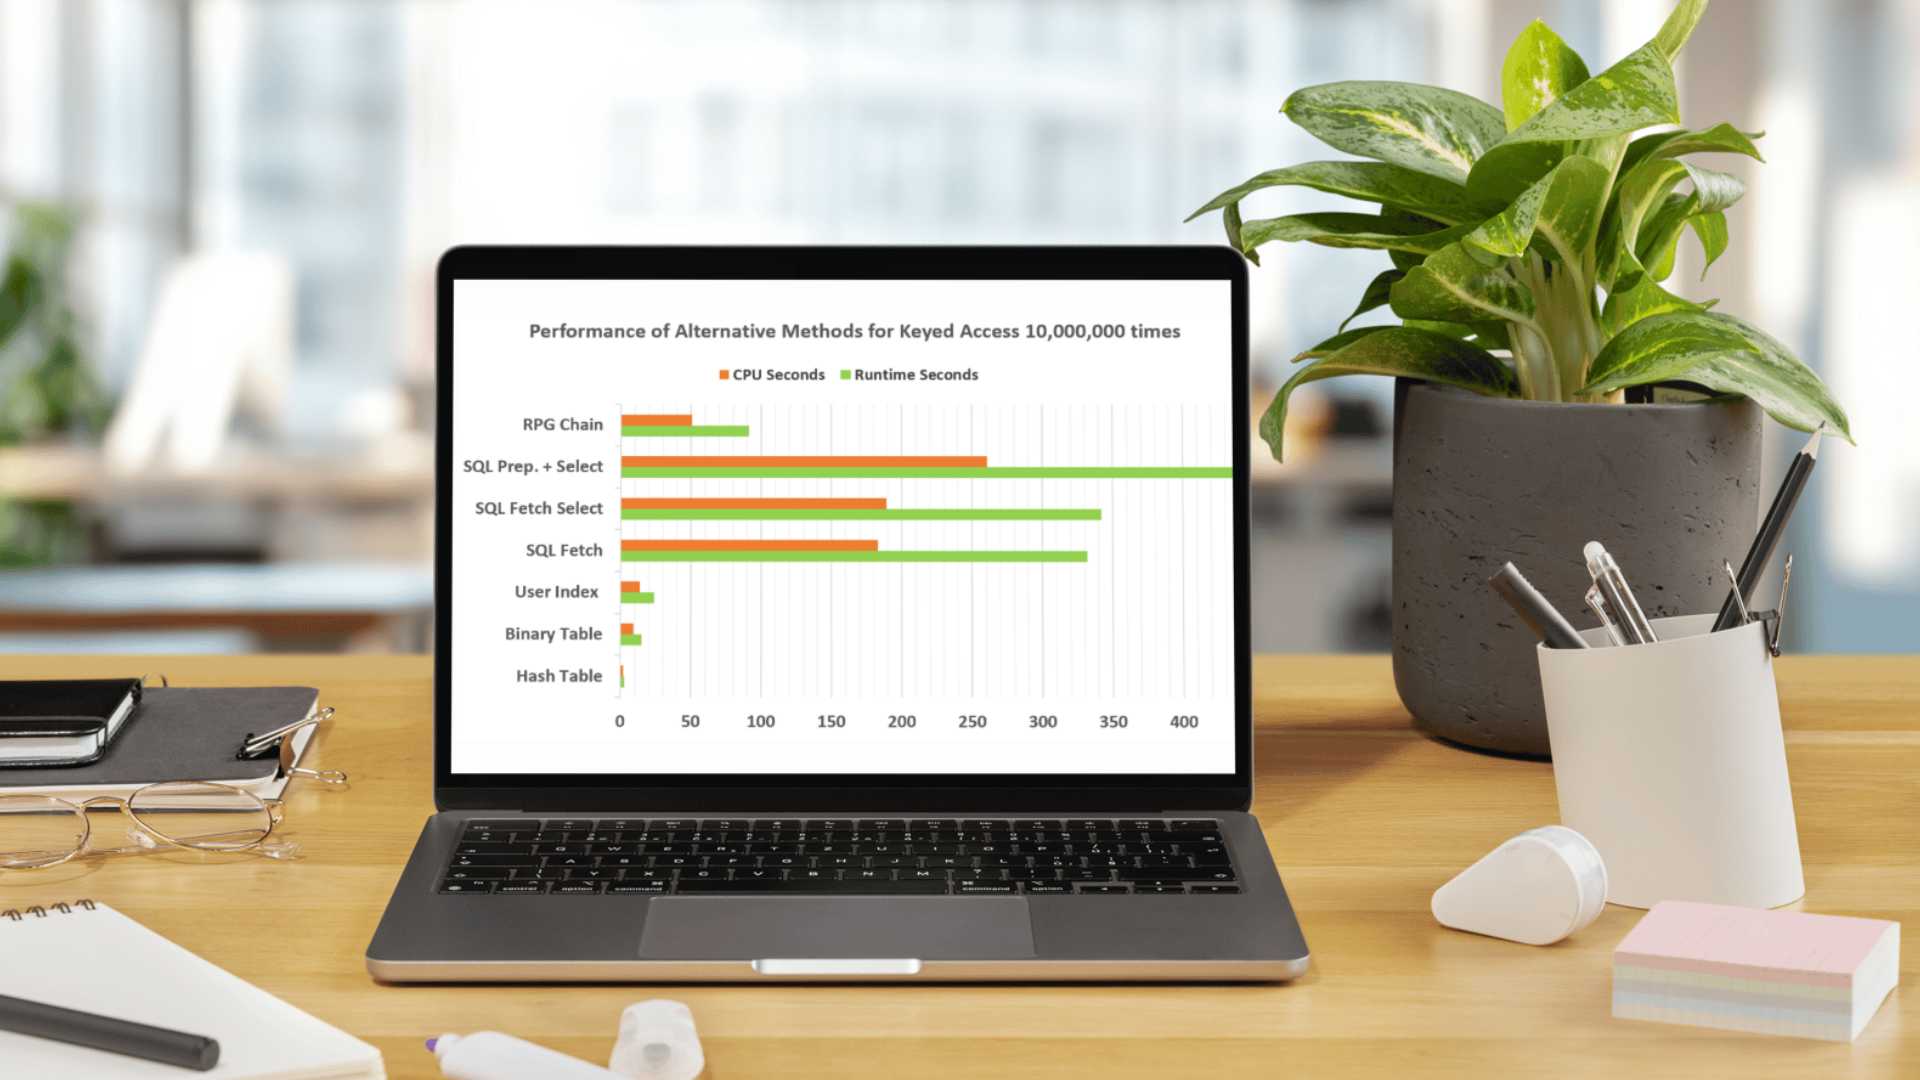
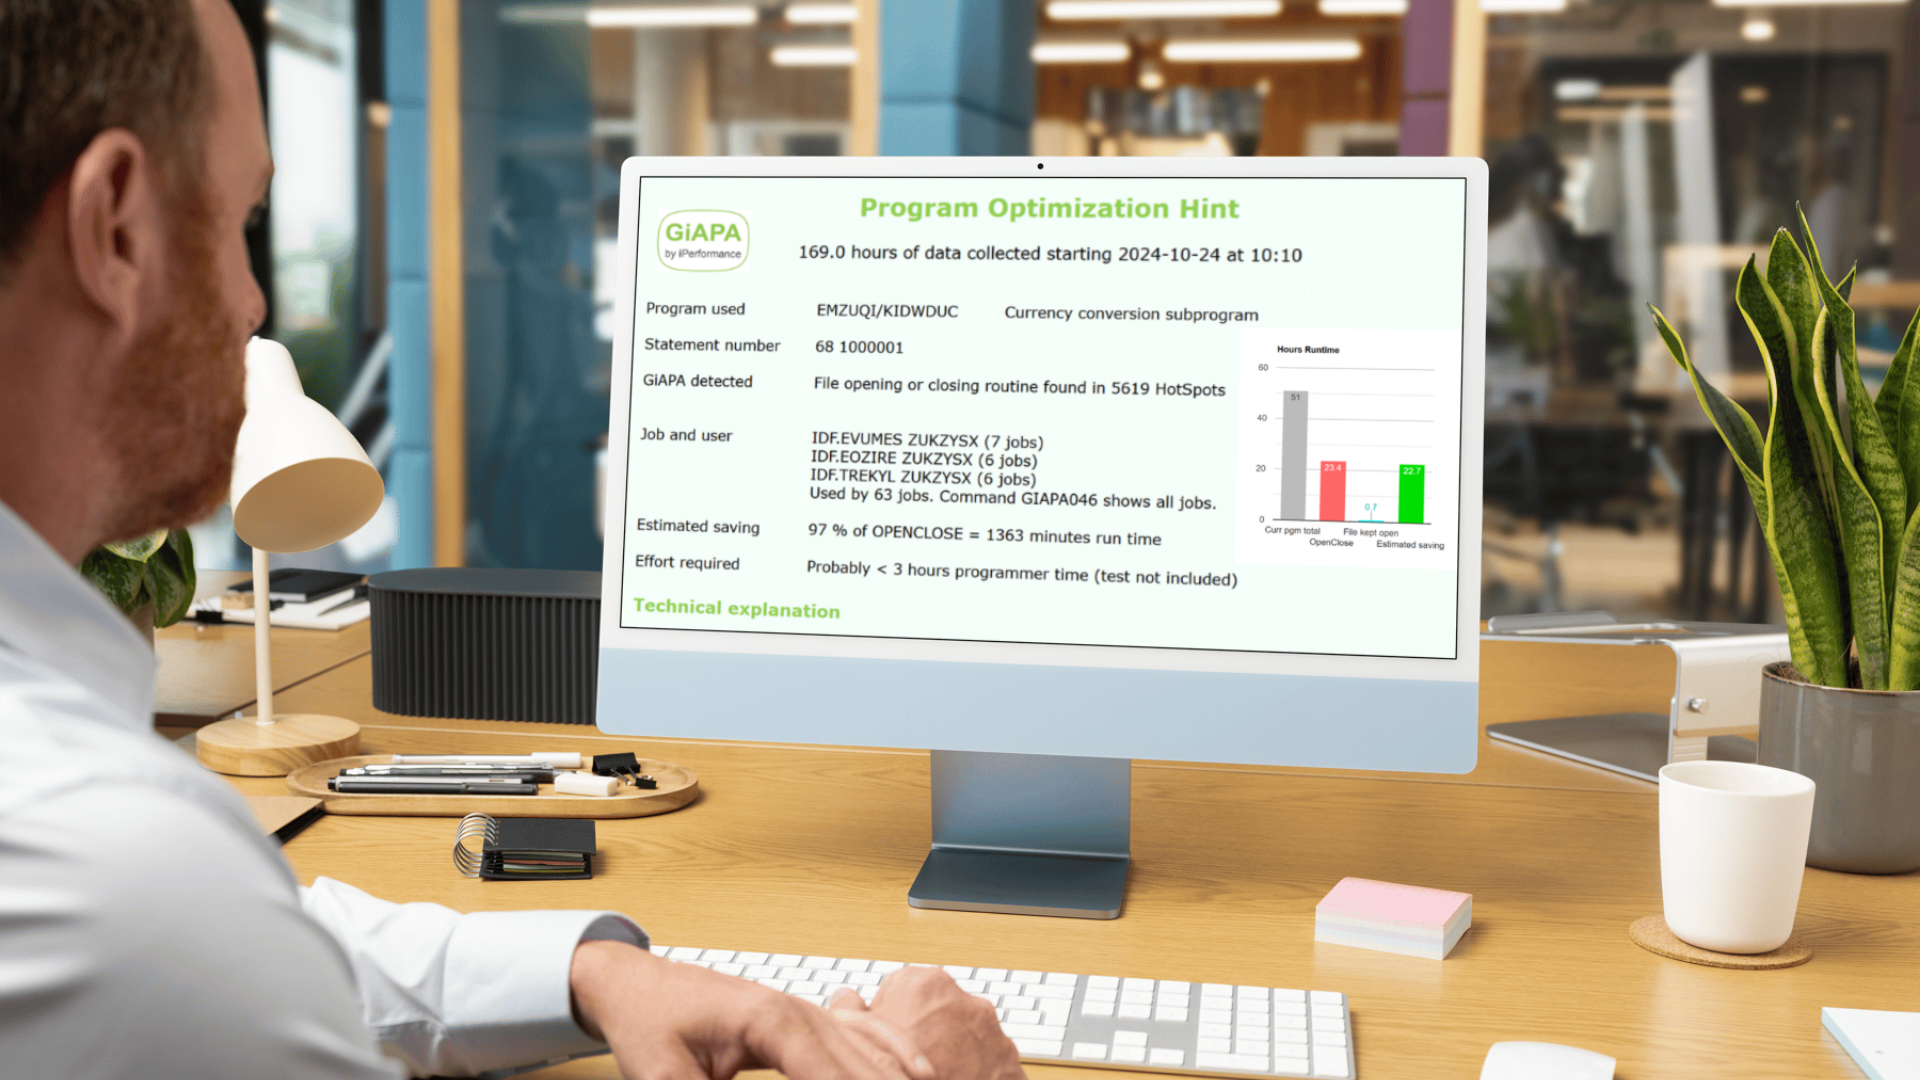
22 types of resource usage, plus call stack data and open file information when a job uses any significant CPU. This data is sufficient to a wide range of analyses of the workload, reasons for delays, trends, and more.
All of this happens without the need for complex configuration or constant tuning. You install it, start the collection – and GiAPA takes care of the rest.
By default, GiAPA collects data every 15 seconds. It’s frequent enough to catch short-term spikes, and long enough to keep resource usage negligible.
If you need more granularity for troubleshooting, the interval can be shortened temporarily for a given job.
That’s another thing I took seriously from the start. GiAPA collects performance data – not business data. It doesn't read the contents of files, user input, or anything confidential. No data is sent outside your system unless you export it.
In other words: you get deep insight without compromising data security or privacy.
Because performance issues don’t always shout. Sometimes, they creep in slowly.
By collecting data continuously – without slowing anything down – GiAPA helps you spot those patterns early, long before they become real problems.
In this section, you'll find in-depth articles, practical tips, and real-world experiences aimed at helping system administrators and IT decision-makers improve performance, reduce resource usage, and get more value from their IBM i environments. Whether you're exploring general best practices or diving into specific GiAPA capabilities, our insights are here to guide you. Explore, learn, and optimize.

.png)
In this section, you'll find in-depth articles, practical tips, and real-world experiences aimed at helping system administrators and IT decision-makers improve performance, reduce resource usage, and get more value from their IBM i environments. Whether you're exploring general best practices or diving into specific GiAPA capabilities, our insights are here to guide you. Explore, learn, and optimize.