June 14, 2025
Why FIFO isn’t Always FIFO: Lessons from User Queues on Power i
This is some text inside of a div block.


System performance isn’t just about what’s happening now — it’s about understanding how things evolve over time.
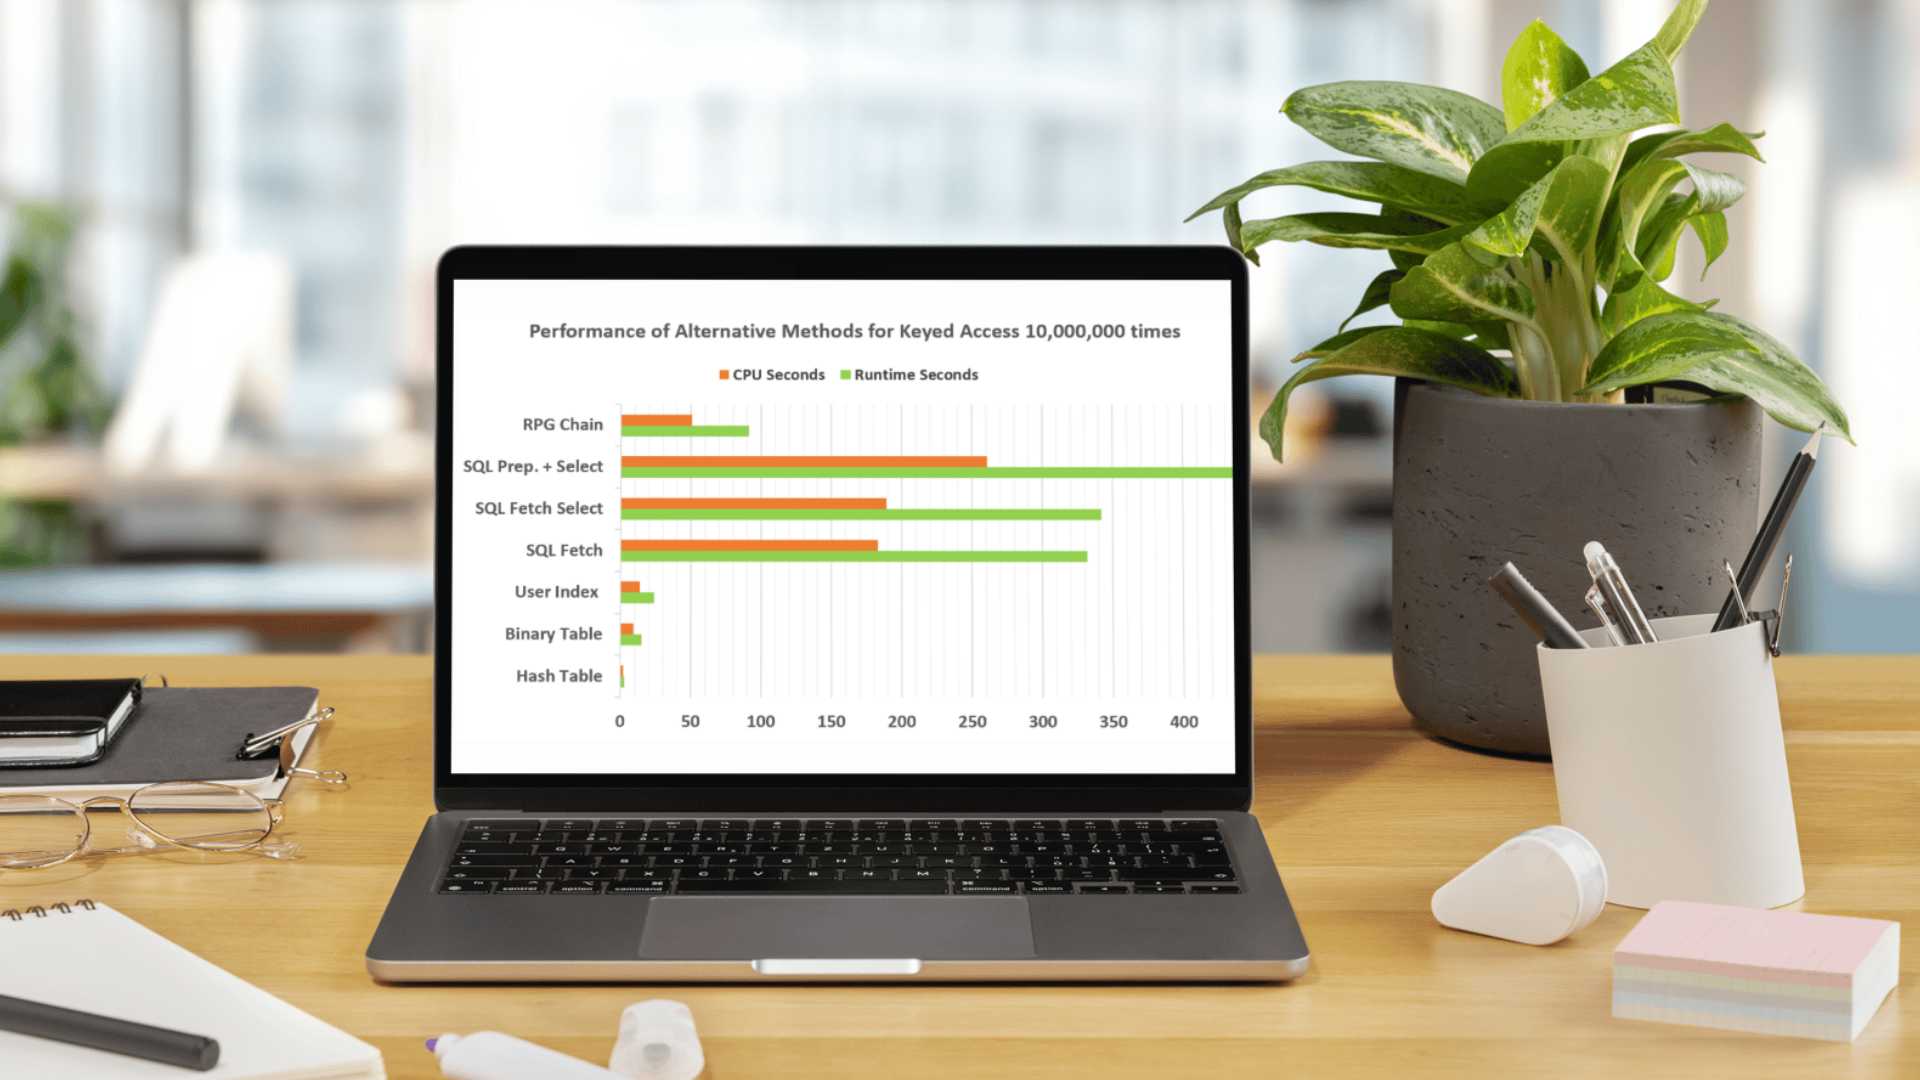
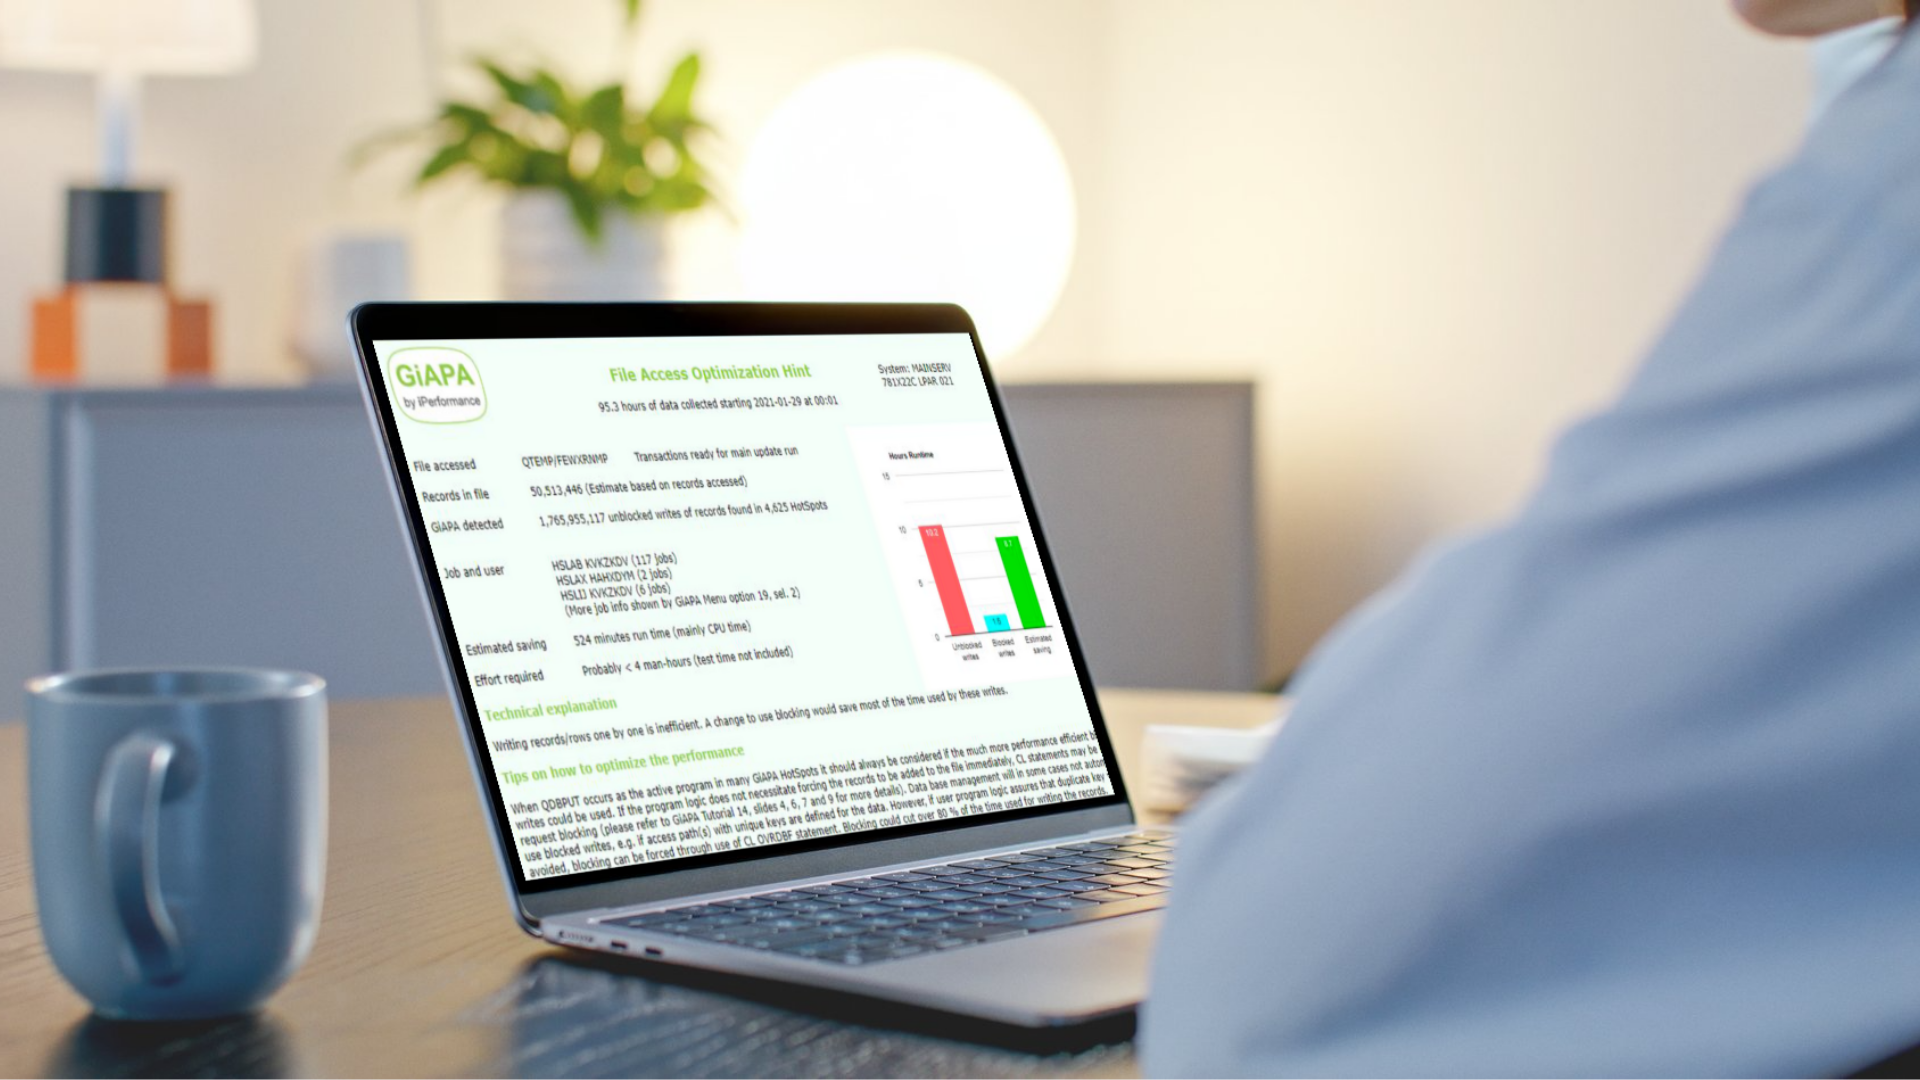
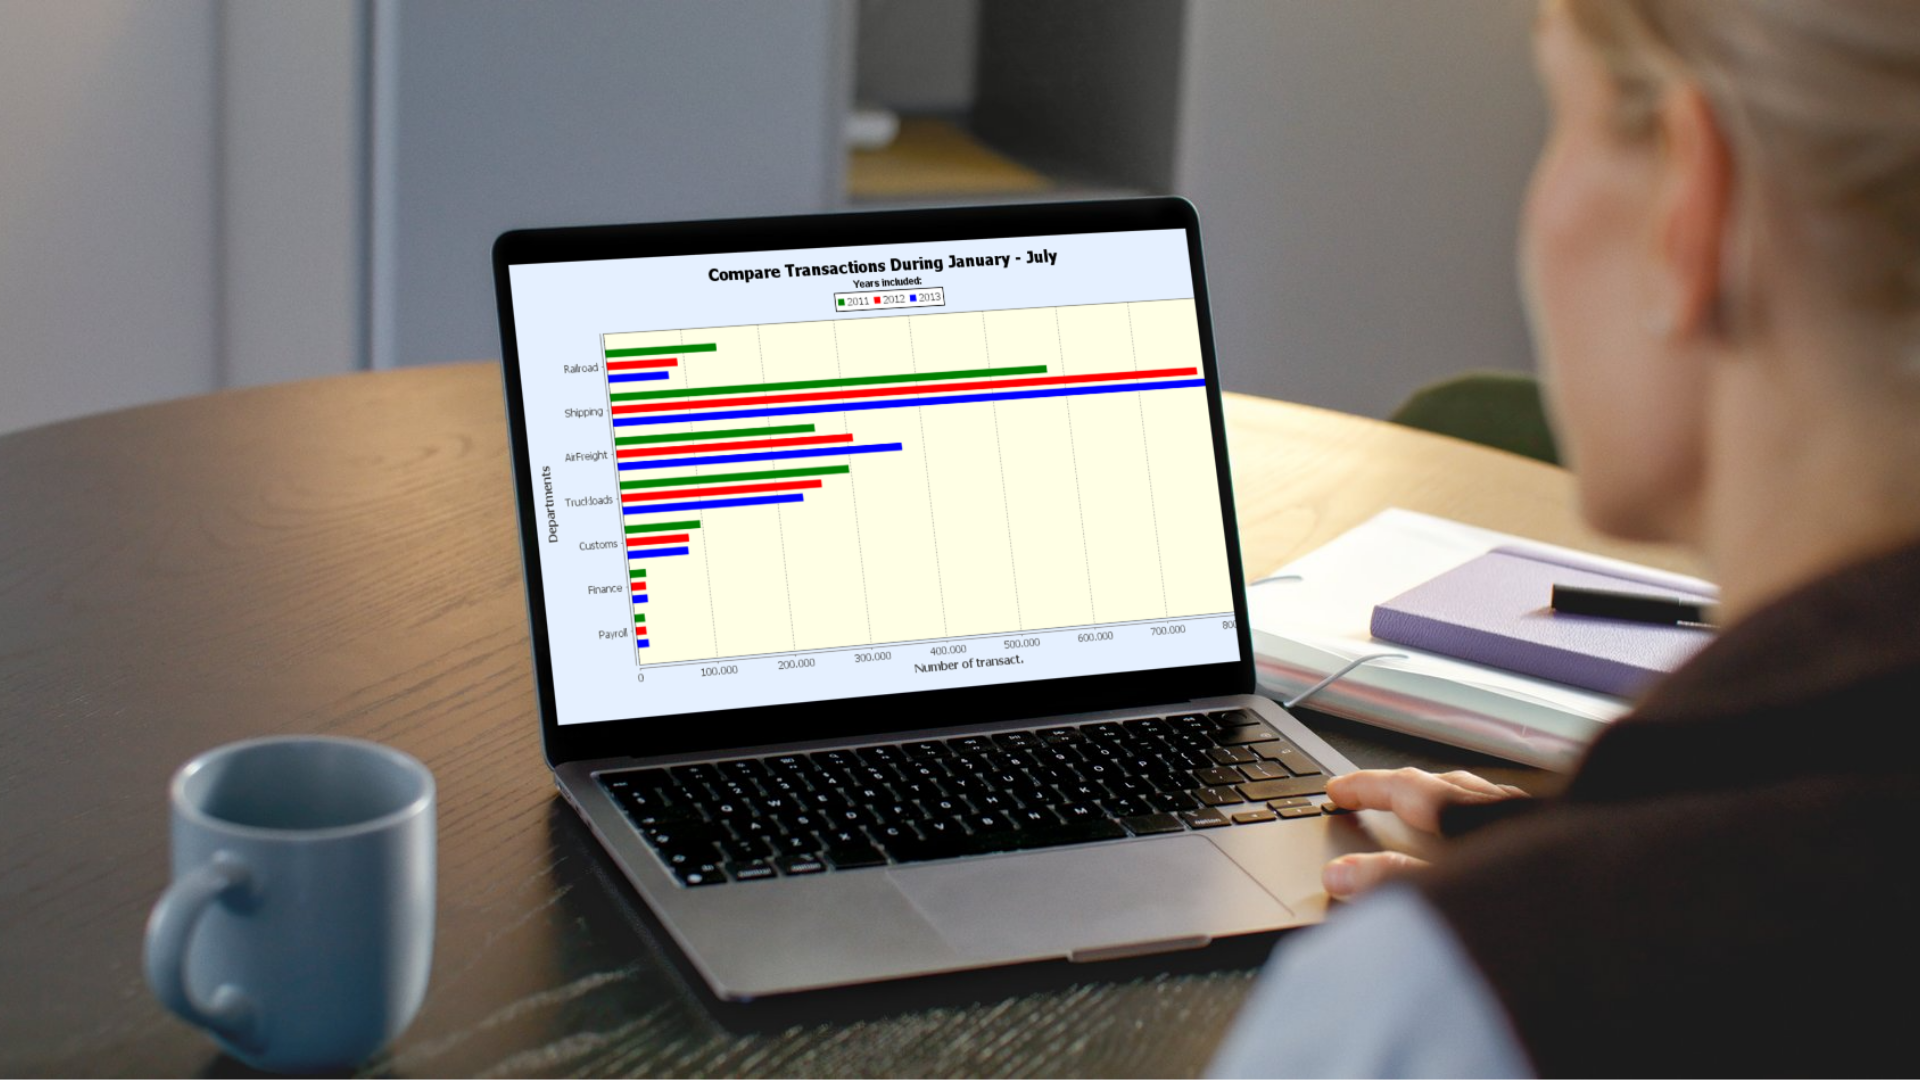
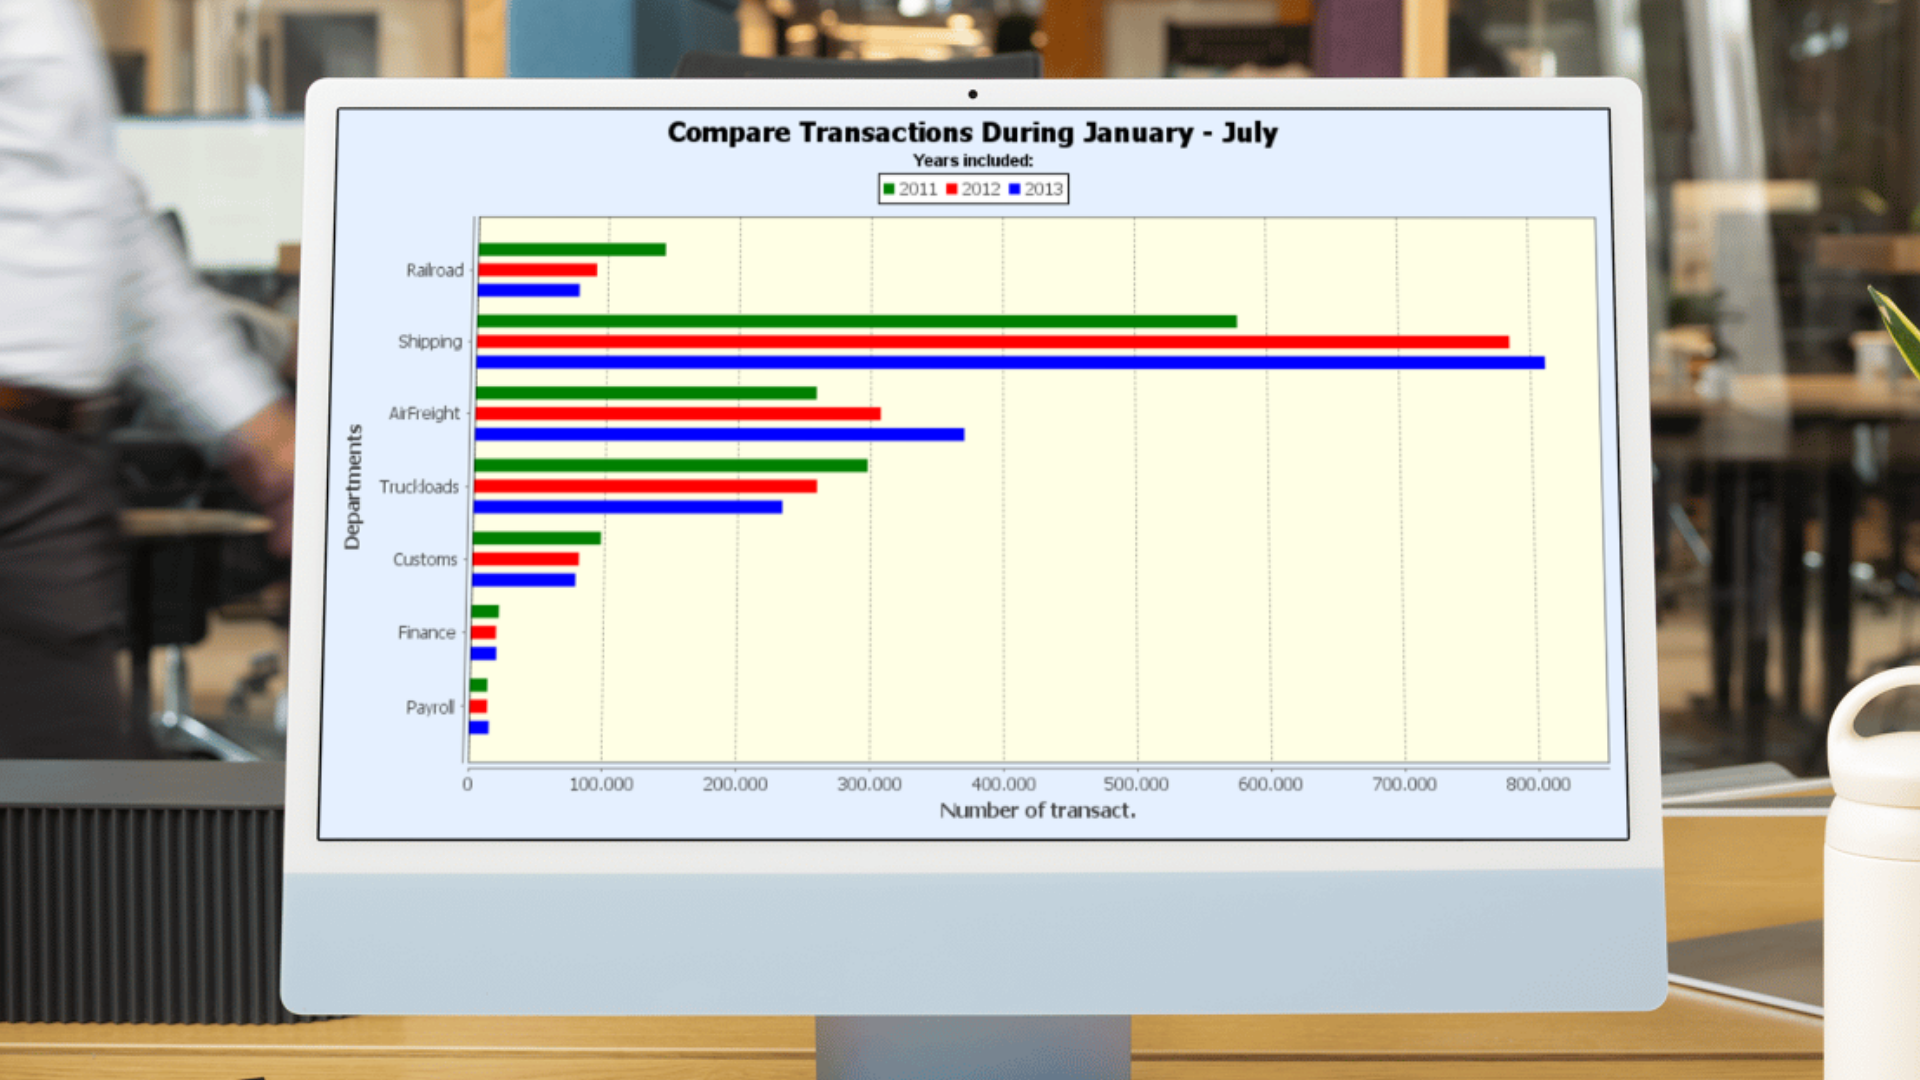
With GiAPA’s continuous data collection and smart visualizations, IT teams can uncover trends that would otherwise stay hidden. Instead of scrolling through logs or comparing reports manually, you get clear diagrams showing:
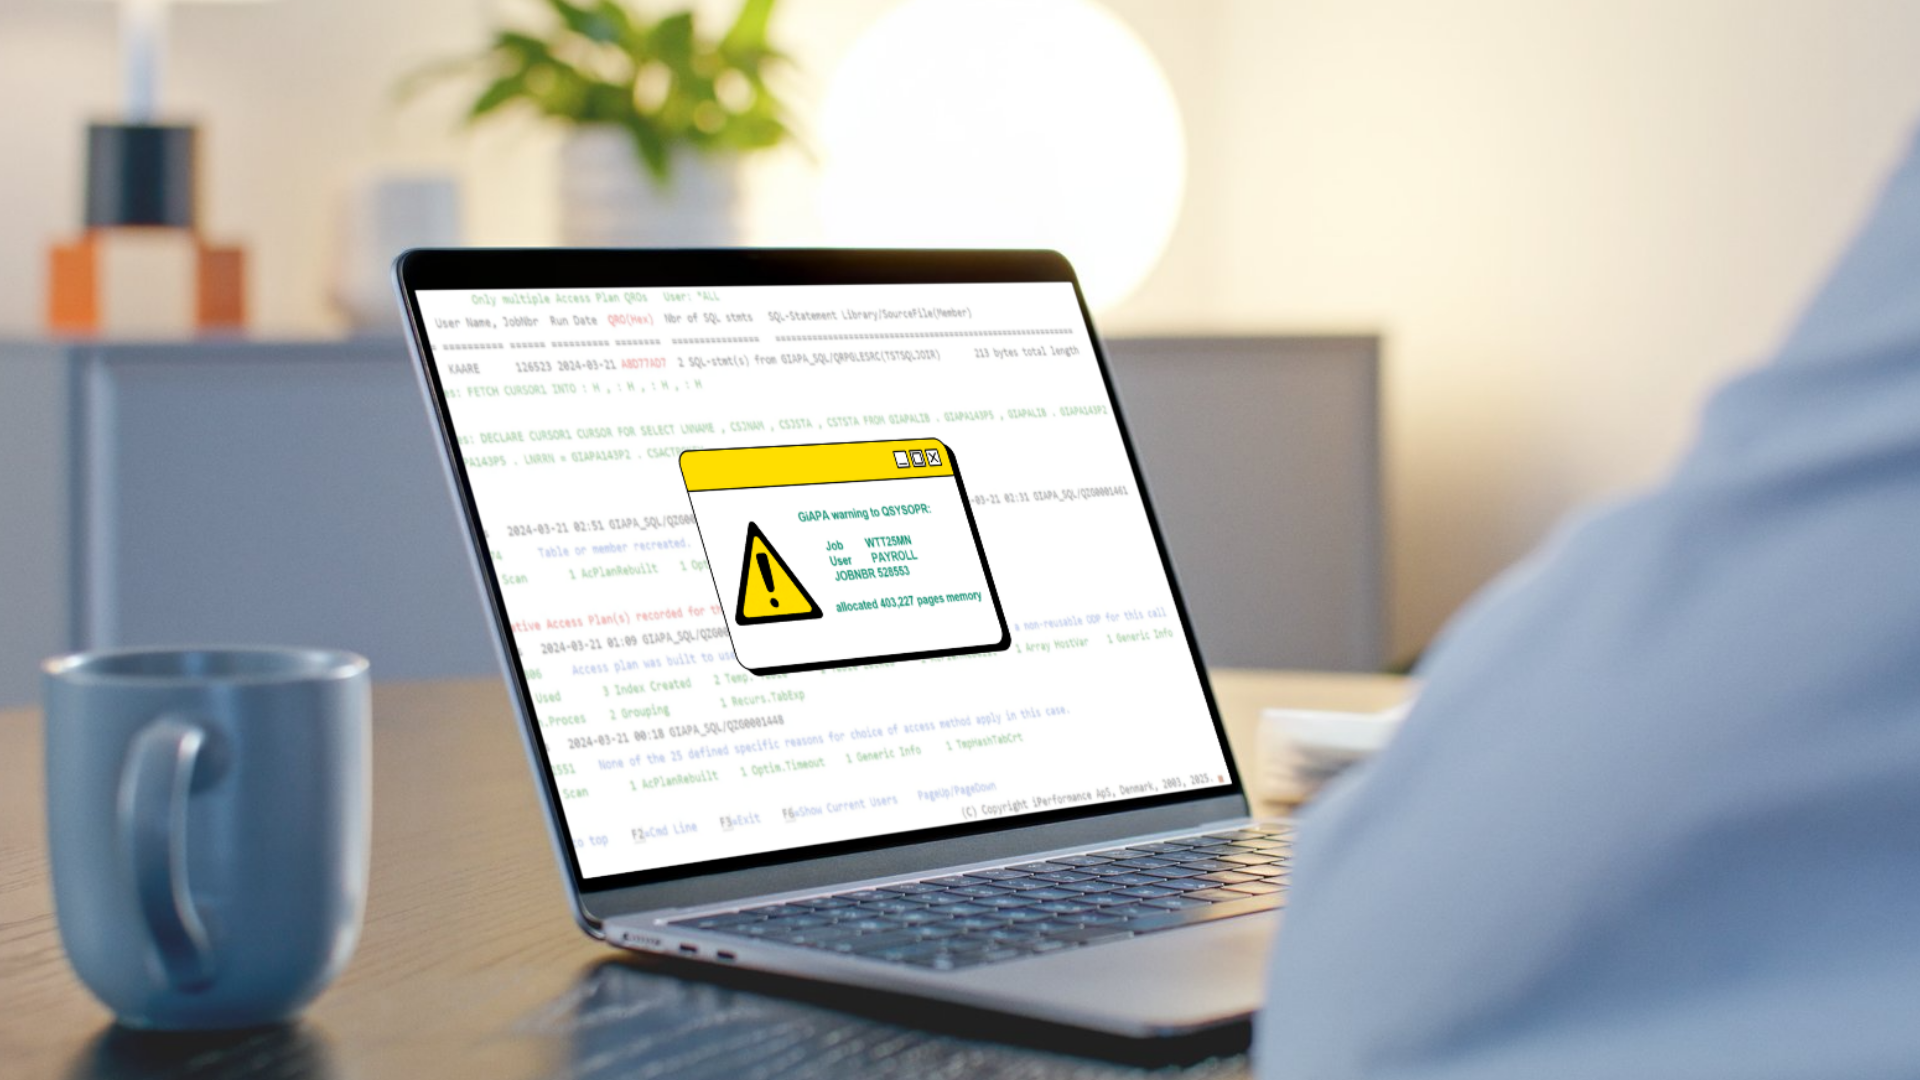
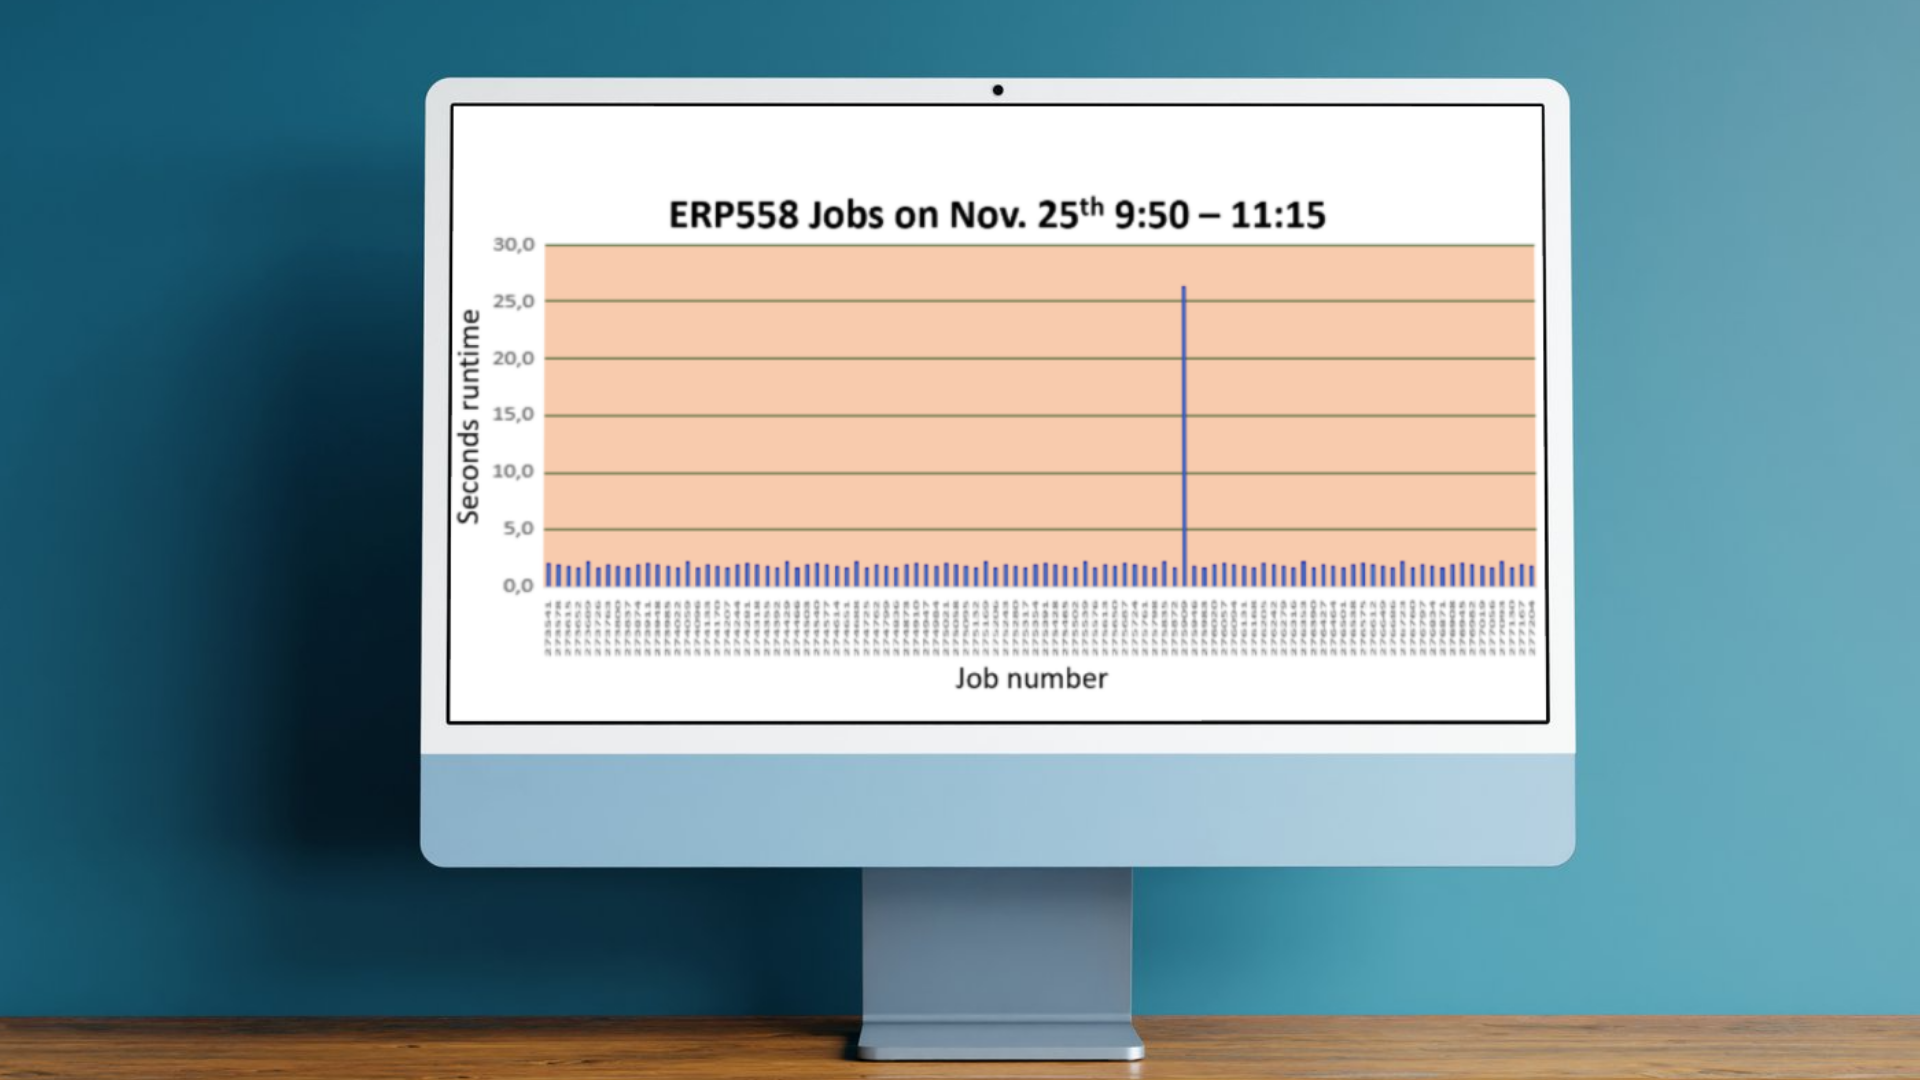
These trends can reveal early signs of trouble — like a job that slowly starts using more and more CPU — or help justify infrastructure investments by showing usage growth with real data.
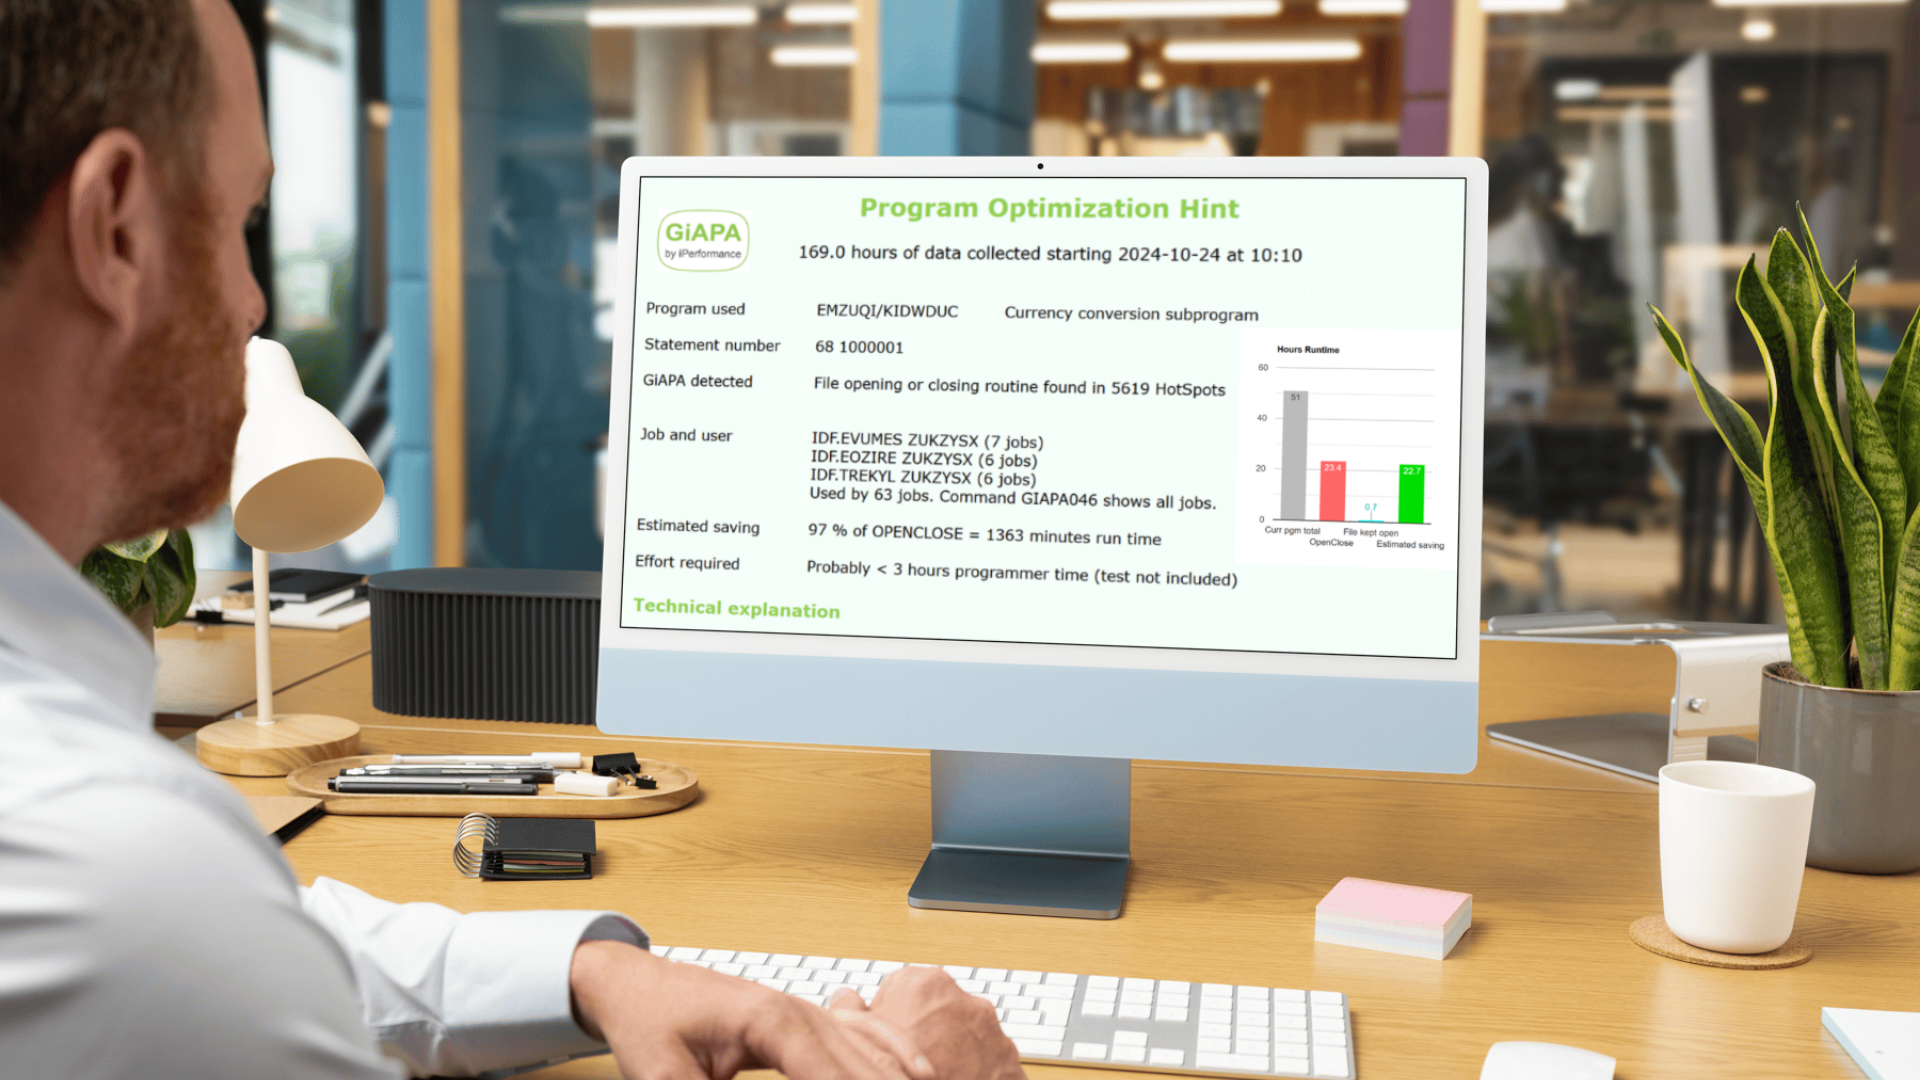
And it’s not just for performance tuning. GiAPA’s graphical reports are great for management as well: they show patterns at a glance, with the depth available when needed.
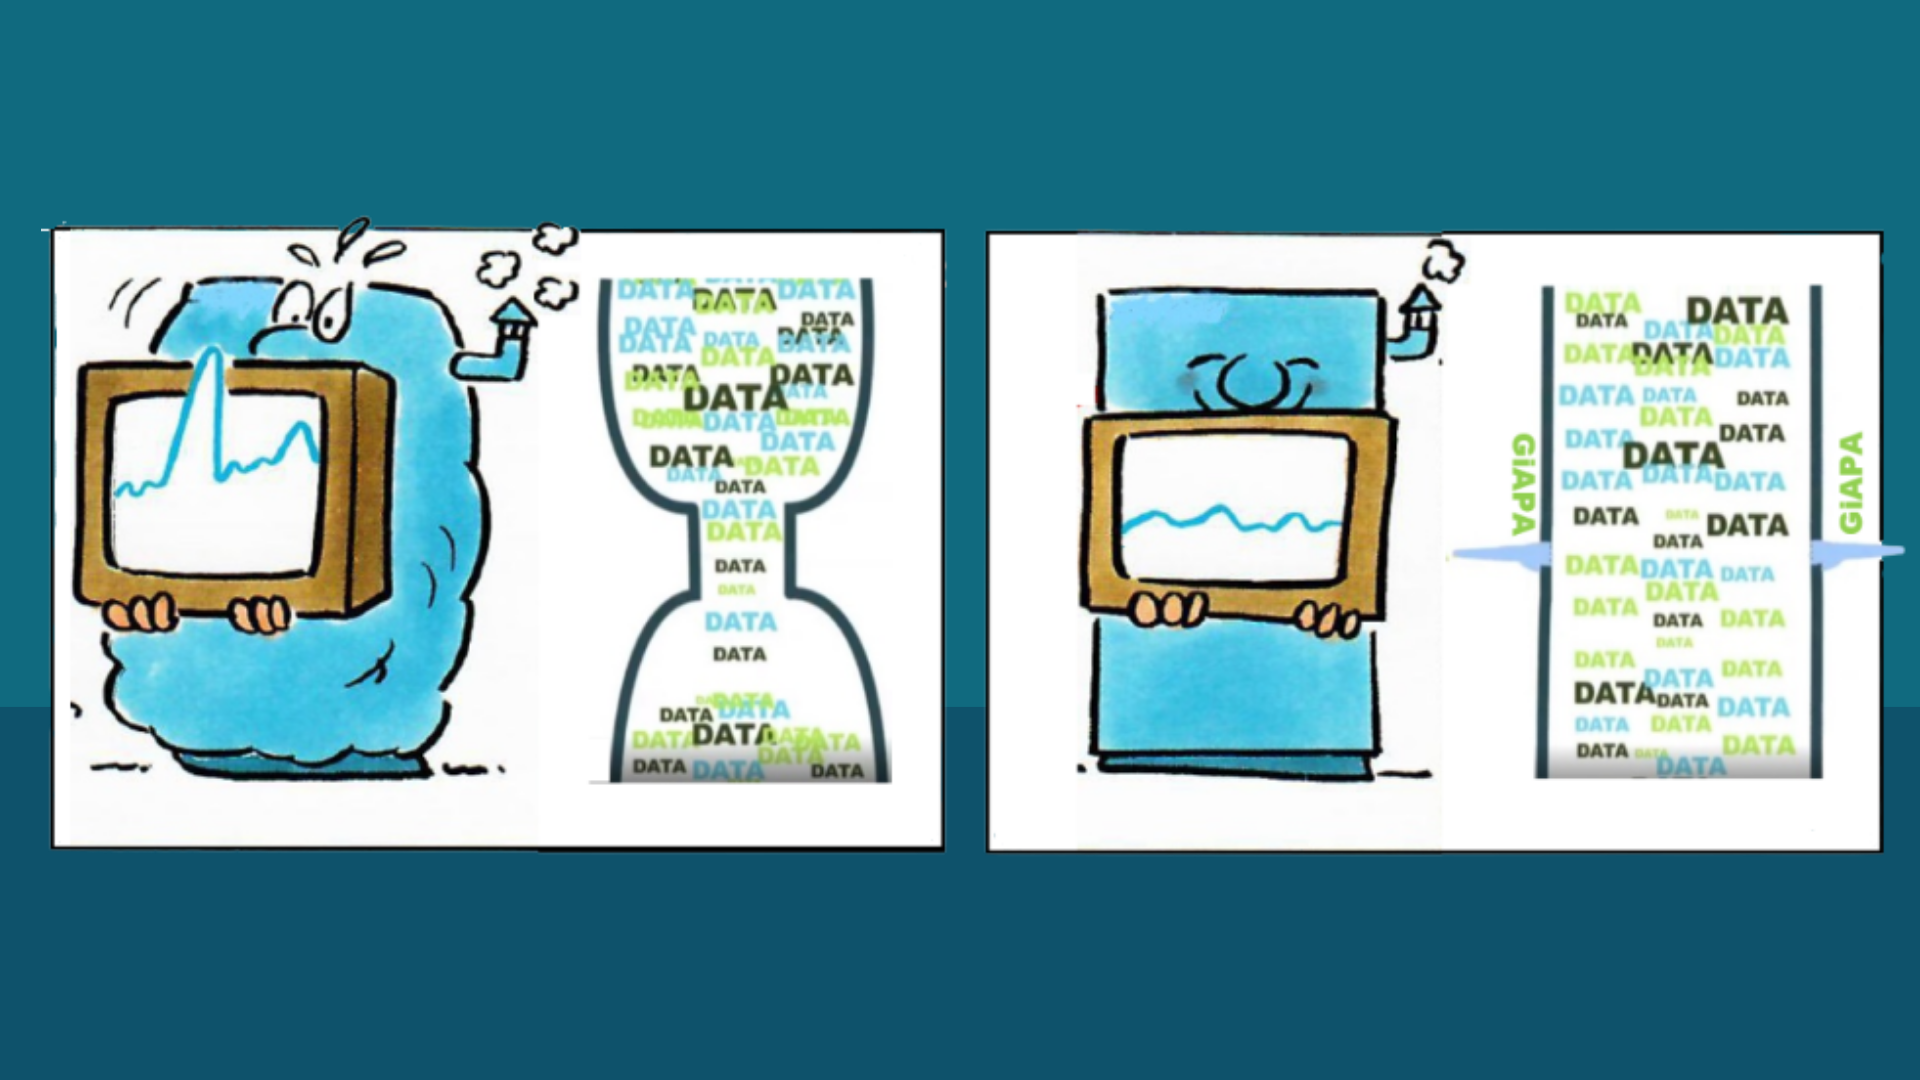
In short: you don’t need to guess what’s changing in your system. GiAPA shows you.
GiAPA makes it easy to visualize long-term trends in system resource usage. With diagrams and smart comparisons, you get visibility into patterns that would otherwise stay hidden.
In this section, you'll find in-depth articles, practical tips, and real-world experiences aimed at helping system administrators and IT decision-makers improve performance, reduce resource usage, and get more value from their IBM i environments. Whether you're exploring general best practices or diving into specific GiAPA capabilities, our insights are here to guide you. Explore, learn, and optimize.

.png)
In this section, you'll find in-depth articles, practical tips, and real-world experiences aimed at helping system administrators and IT decision-makers improve performance, reduce resource usage, and get more value from their IBM i environments. Whether you're exploring general best practices or diving into specific GiAPA capabilities, our insights are here to guide you. Explore, learn, and optimize.