.svg)
How to Minimize IBM Power i Server Breakdowns

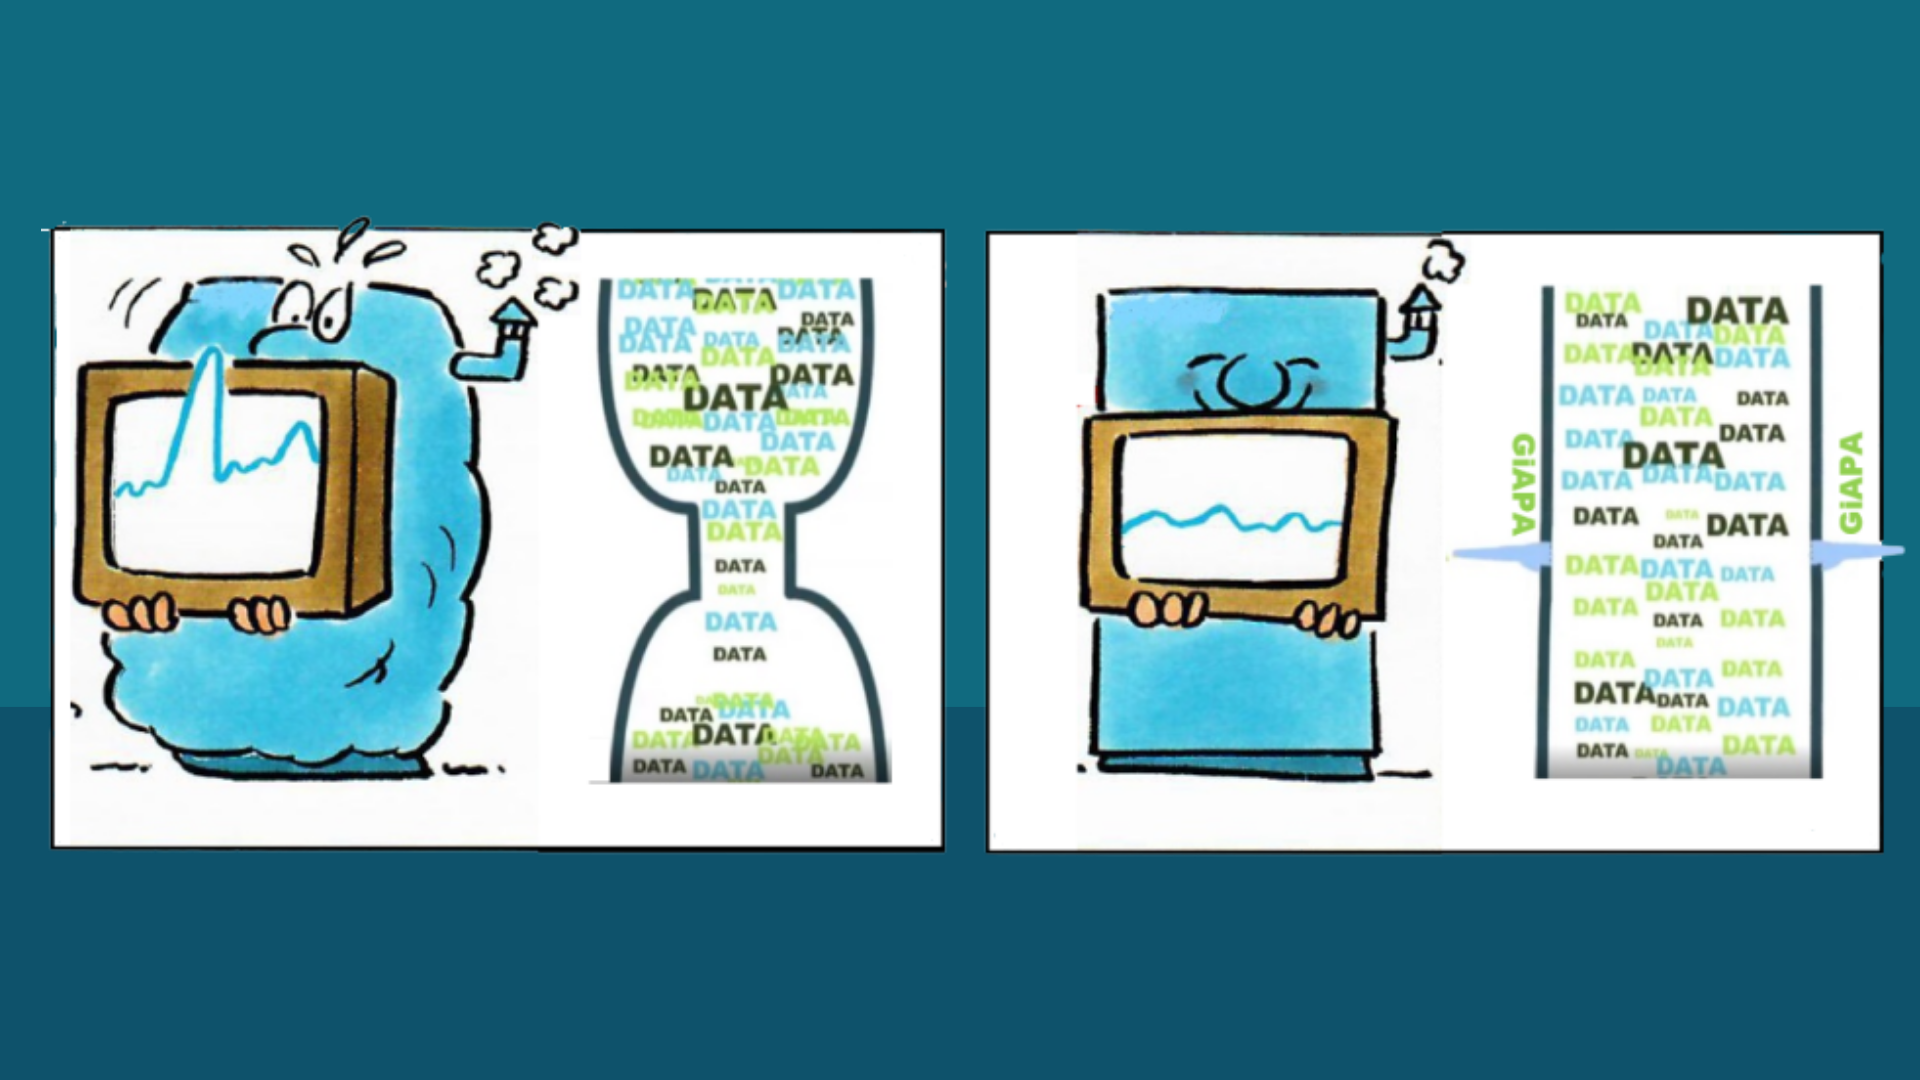
IBM Power i servers are famously reliable, often running for months or even years without interruption. But when a breakdown does occur—typically on large servers running complex, multi-job workloads—it’s a serious event.
In most cases, the root cause is hard to identify. Was it a job that suddenly consumed too much CPU, memory, or disk I/O? Without detailed diagnostics, even IBM support specialists may struggle to find the answer.
Historically, continuously collecting very detailed resource data for all jobs would have been unthinkable. It would consume too much CPU, I/O, and disk space. But that’s no longer the case.
At iPerformance ApS, we’ve developed GiAPA, a lightweight monitoring tool that collects detailed resource usage from every job and task—every 15 seconds. It pulls this data directly from IBM’s performance collector APIs and includes:
- CPU time in milliseconds
- Memory allocation
- 15 types of I/O
- And more
Whenever a job exceeds 4% CPU usage in a 15-second interval, GiAPA automatically collects additionally program call stacks and file access data. All data is stored in a compressed binary format, keeping disk usage low and CPU impact below 0.1%.
If GiAPA helps prevent even one crash, it already provides significant ROI. But in most installations, the real value is broader:
- Operations teams can investigate issues even after the fact
- Developers can detect and fix inefficiencies before they become problems
- Management can monitor long-term usage trends by application, department, or user group
With GiAPA, you don’t just reduce the risk of server crashes—you gain complete visibility into how your Power i system is used, by whom, and for what.
.svg)
GiAPA News & Tips
.png)