Unleash the full potential of your IBM i system

Predictive Insights

Don’t just react. See performance trends before they become problems.GiAPA continuously collects data on jobs, SQL, and system usage so you can make informed decisions early.
  • checkicon
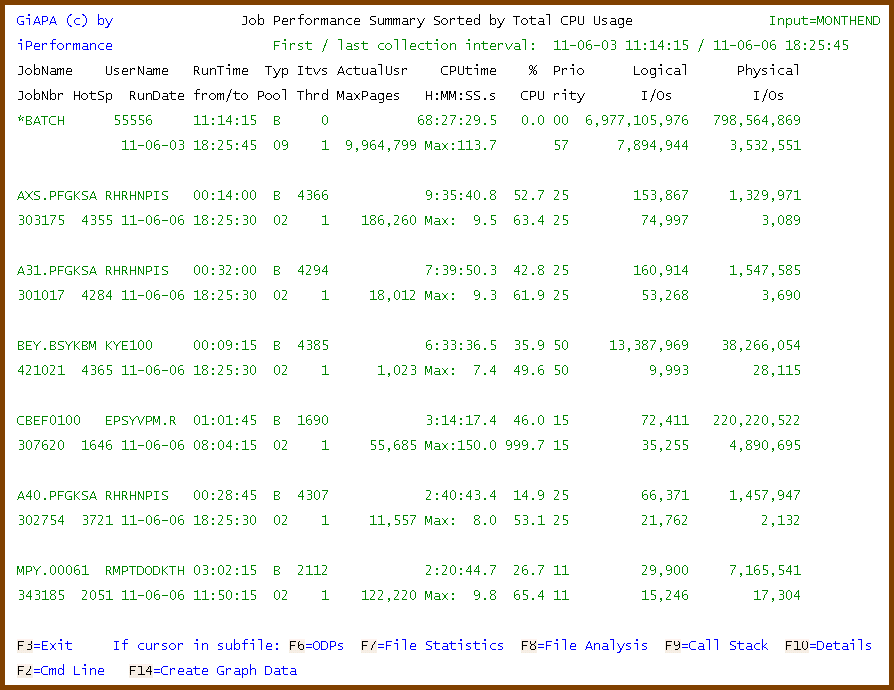
    Job activity tracking
  • checkicon
    SQL performance over time
  • checkicon
    CPU, disk and memory usage
dashboardimageimage

Real-time analytics

Monitor your system as it runs.GiAPA’s live view helps you understand what’s happening
– and why.
dashboardavarage imageprofit imagethis image

Customizable Dashboards

Focus on what matters most to you.GiAPA lets you filter and adjust your view to highlight key metrics, jobs or time periods.
dashboardimageimage

Smarter support and smoother operations with GiAPA

GiAPA helps you speed up your applications,
resolve performance issues faster,
and give users a more powerful system.

Job Monitoring

Automatically detect jobs that run too long, use too much CPU or block others from completing.

SQL Analysis

Find slow queries and inefficient access patterns that degrade application performance.

Performance Communication

Give IT and business teams a shared view of system health to make better decisions together.

GiAPA smart system monitoring

Track performance, detect issues and understand your IBM i system in real time – without adding complexity.
  • image
    Continuous data collection
  • image
    Customizable performance dashboards
  • image
    Full visibility into jobs, SQL and system load
  • image
    Proactive alerts and troubleshooting insights
Get started
imageimage
imageimage
imageimage
sales imagesales dash image

The Power of GiAPA Insights

GiAPA doesn't just collect data...
sales icon

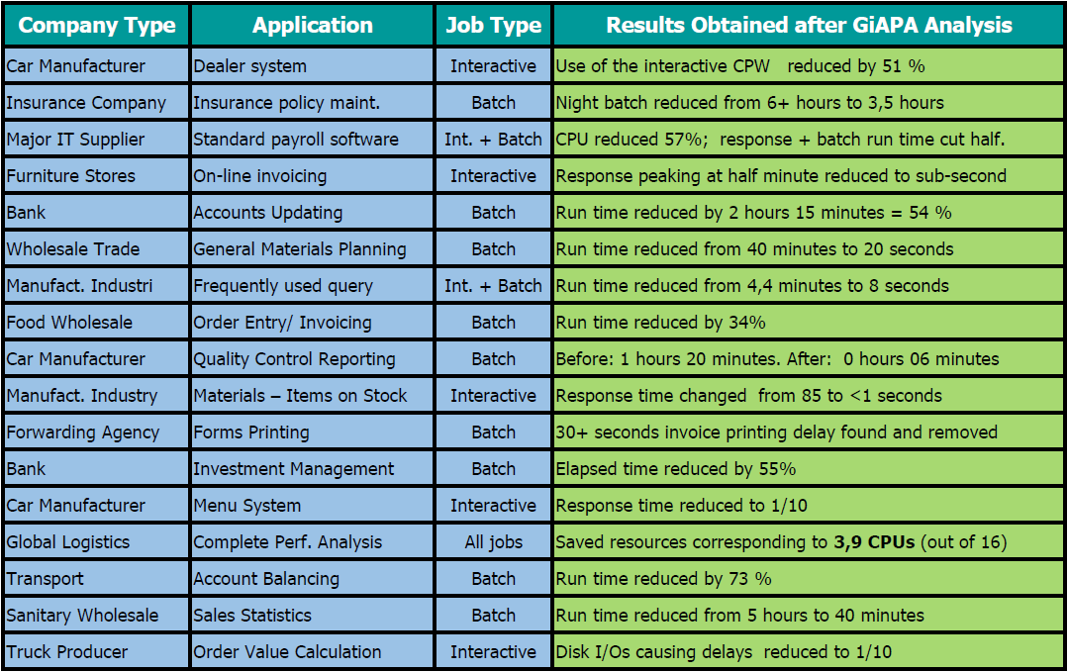
GiAPA shows you exactly where to optimize your IBM i applications

sales icon

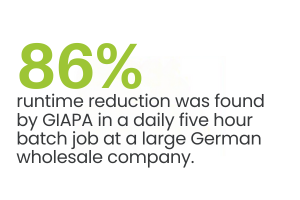
GiAPA estimates how much runtime can be saved

sales icon

GiAPA estimates how much effort is needed to fix the problem

GiAPA in a Nutshell

In addition to resource usage data for all jobs, GiAPA also collects data showing
what the jobs are doing.

lead check icon

This additional data includes
how each file is accessed, and
which program function is active

lead check icon

Statistics on these examples of job activity enables GiAPA to run automatic analysis pinpointing performance inefficiencies.

lead check icon
Start Free Trial
lead imagelead shapeLead CardLead Feature

Performance Insights

In this section, you'll find in-depth articles, practical tips, and real-world experiences aimed at helping system administrators and IT decision-makers improve performance, reduce resource usage, and get more value from their IBM i environments. Whether you're exploring general best practices or diving into specific GiAPA capabilities, our insights are here to guide you. Explore, learn, and optimize.