June 14, 2025
Why FIFO isn’t Always FIFO: Lessons from User Queues on Power i
This is some text inside of a div block.


Data areas are a familiar tool for many Power i developers—but in terms of performance, they’re not always your friend. When we analyze customer systems, we’re often surprised by how frequently data areas show up in performance-critical parts of the code. If your application accesses a data area inside the main loop of a program, chances are you're slowing things down more than you realize.
Data areas have been around since the System/38 days, and they still follow the same rules: every usage generates a disk access. That might not sound like much, but if your program is hitting a data area repeatedly—especially in a tight loop—that overhead adds up fast.
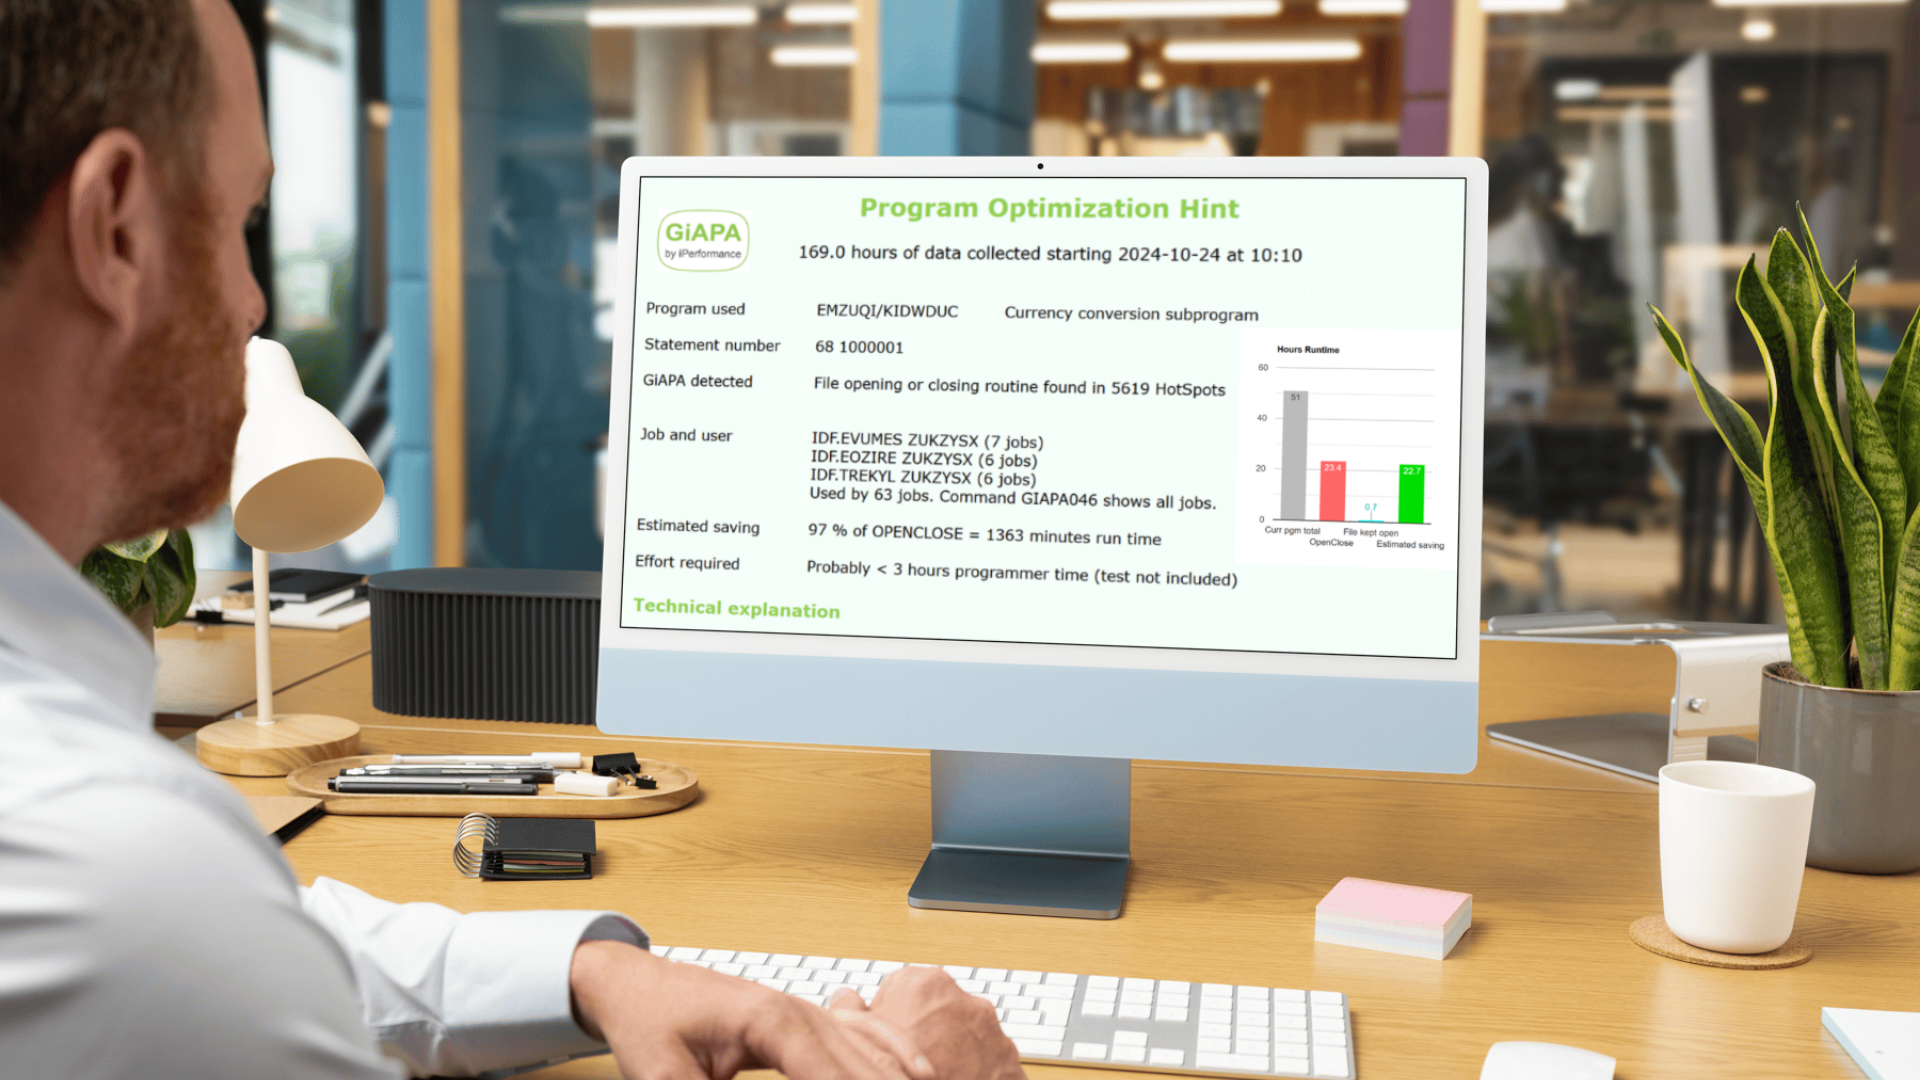
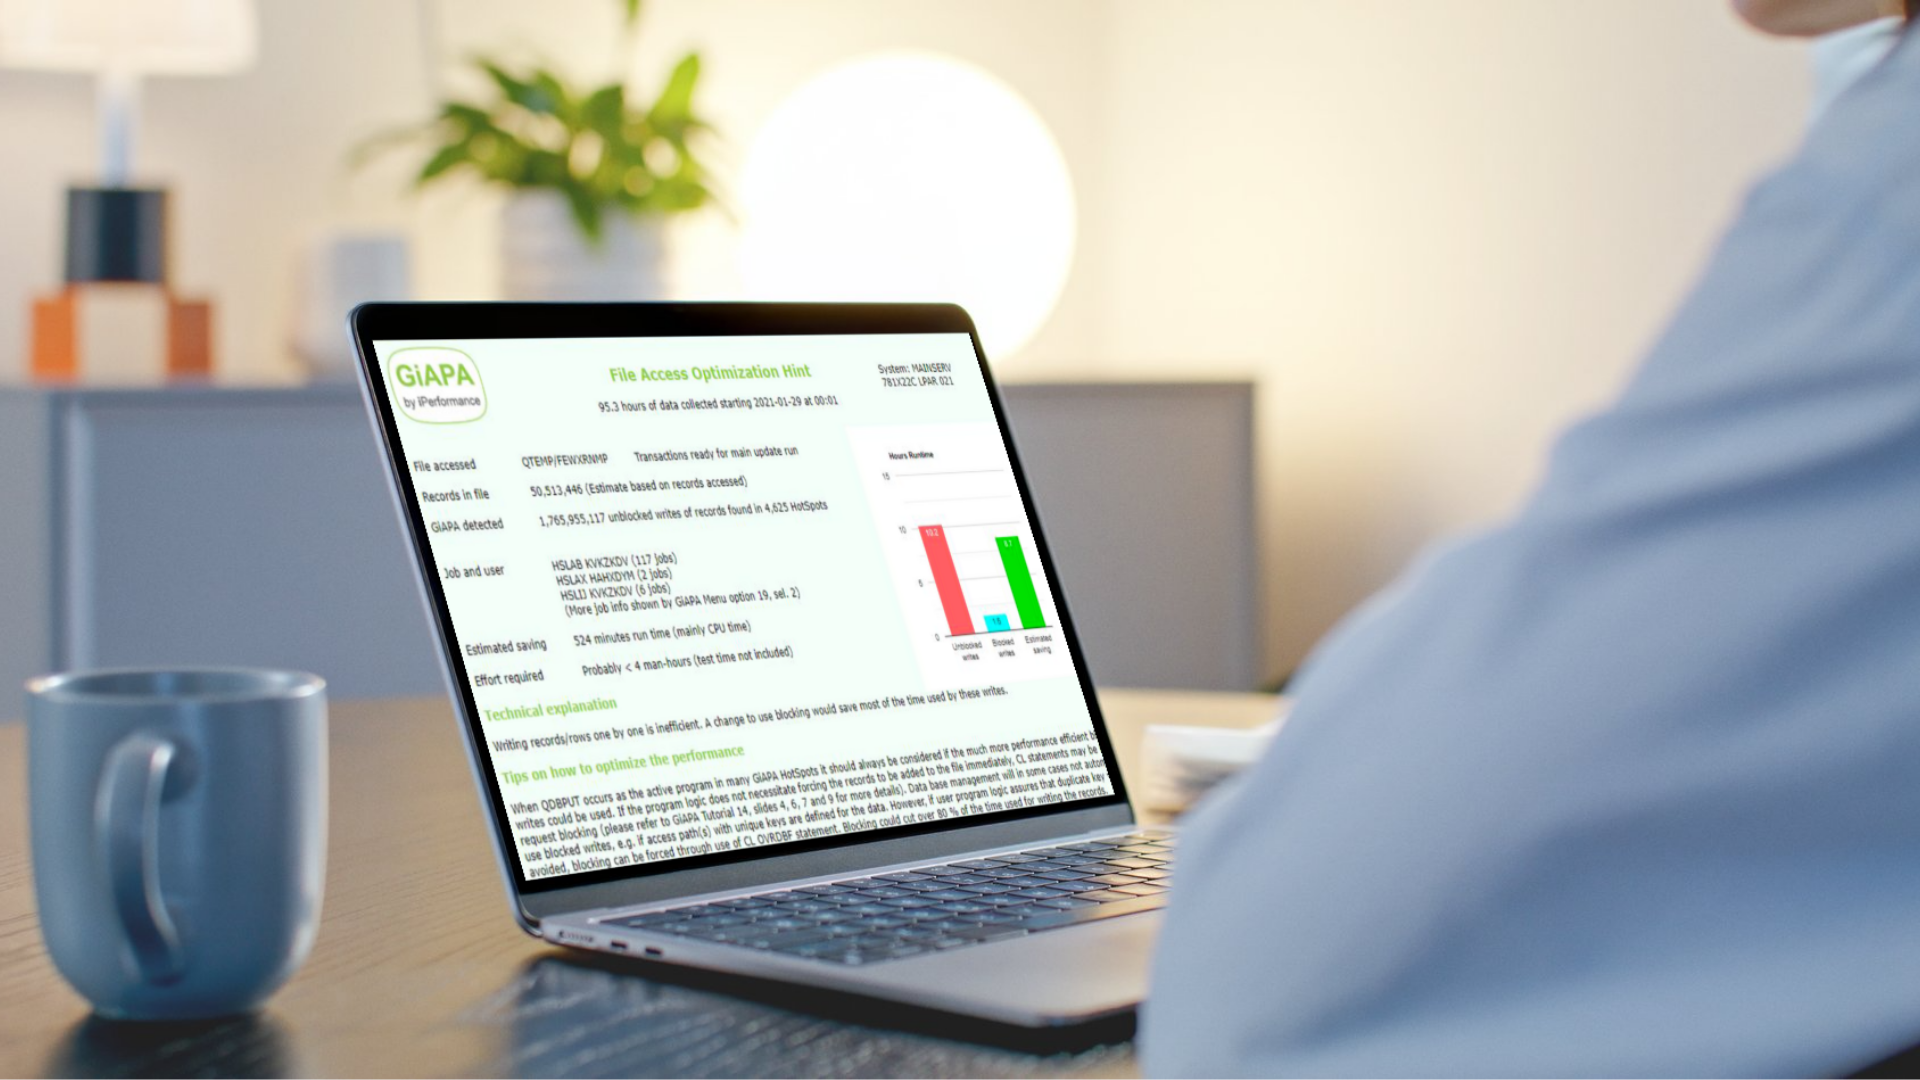
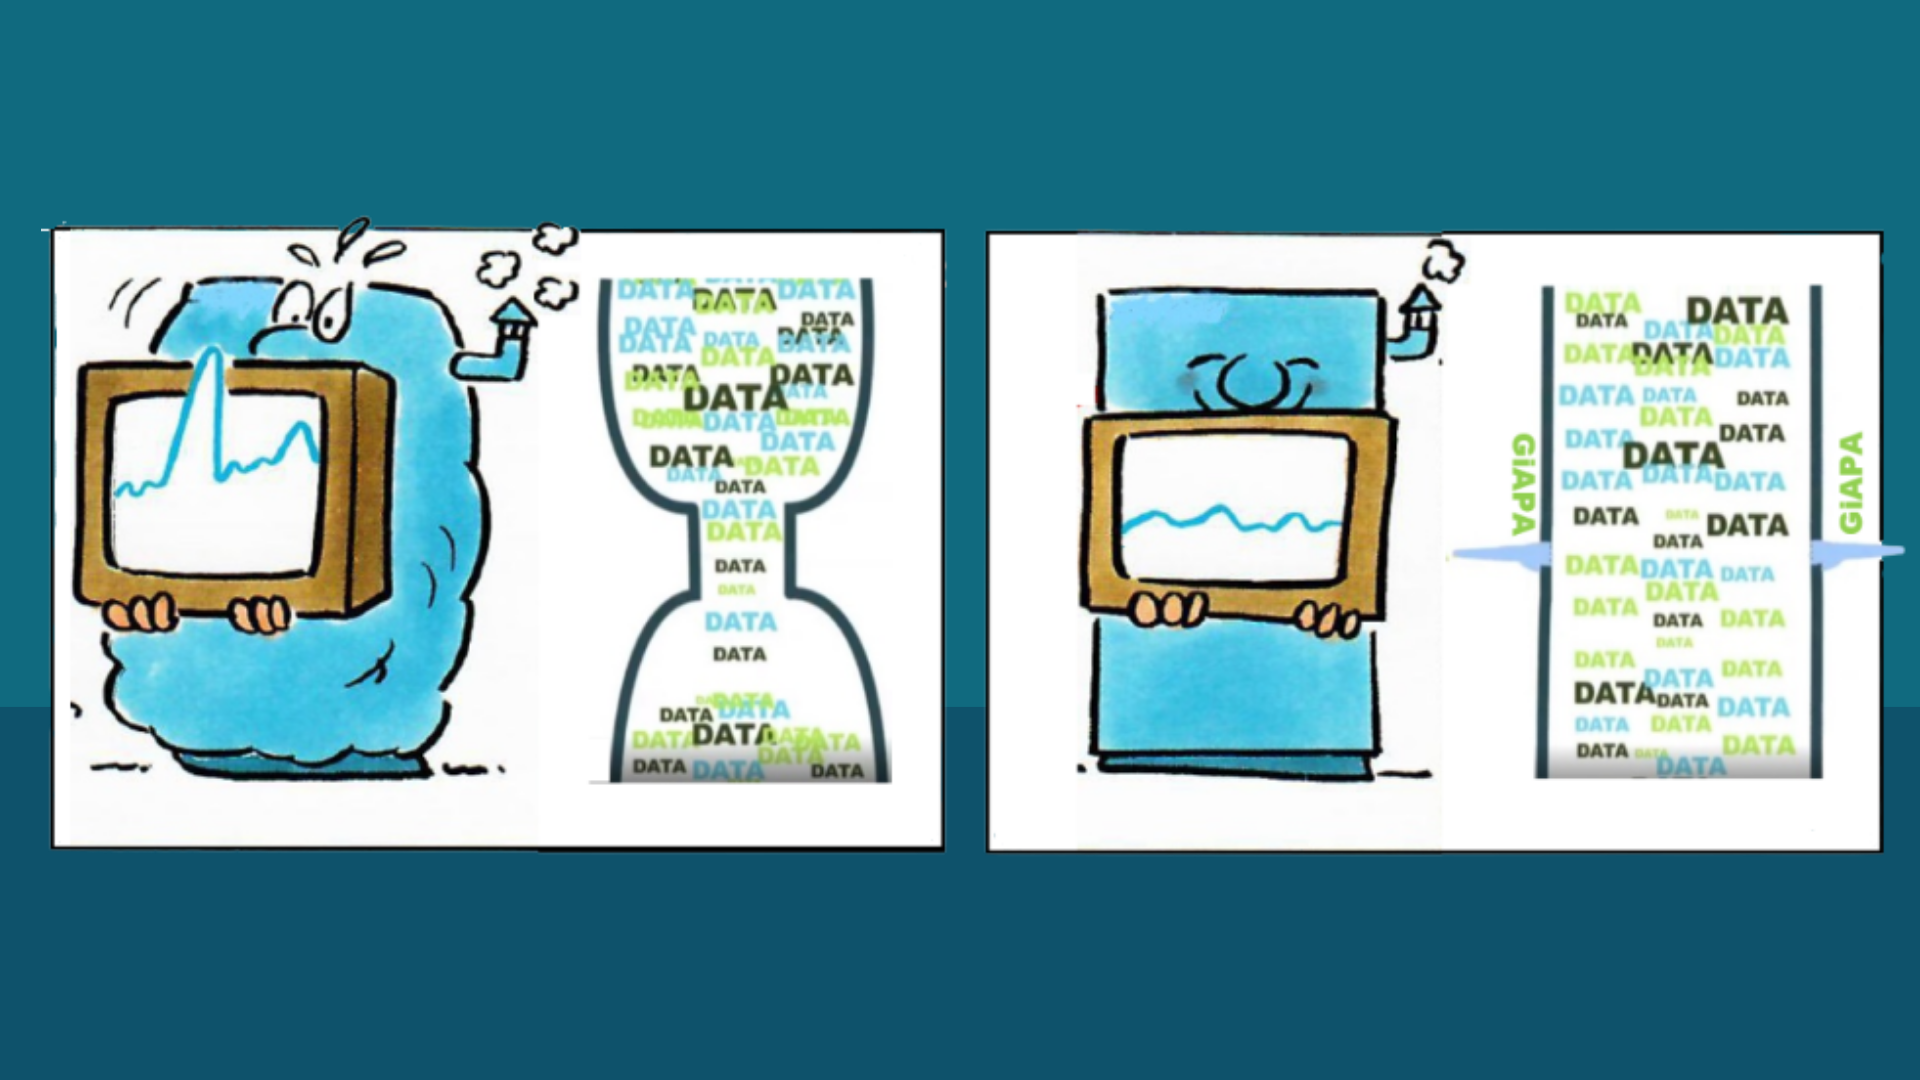
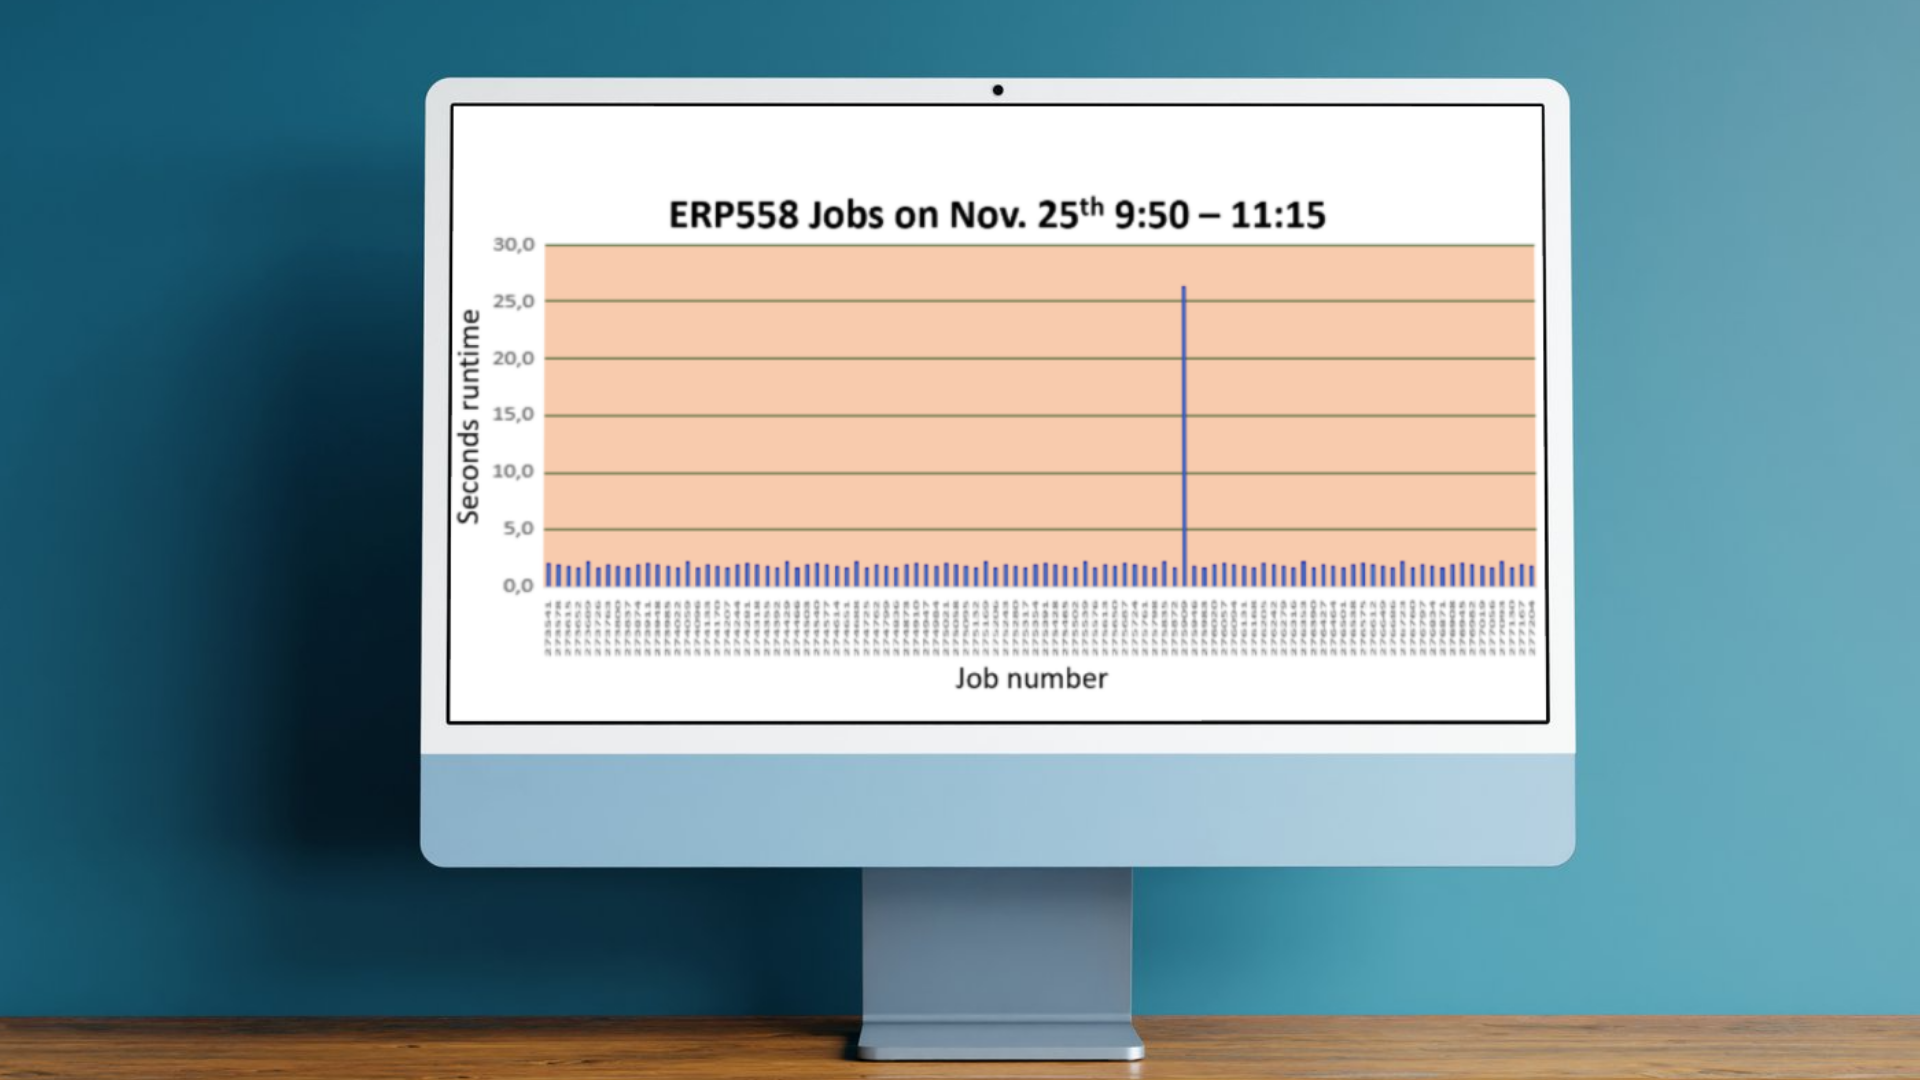
Our tool GiAPA frequently highlights this issue in its reports. One customer job, for example, showed a dramatic performance gain potential simply by replacing the data area with a more efficient object.
Instead of data areas, we recommend using user spaces. Many developers aren’t familiar with them, but they’re essentially large, memory-resident data areas—up to 16 MB in size—that offer much better performance.
Why are they so fast?
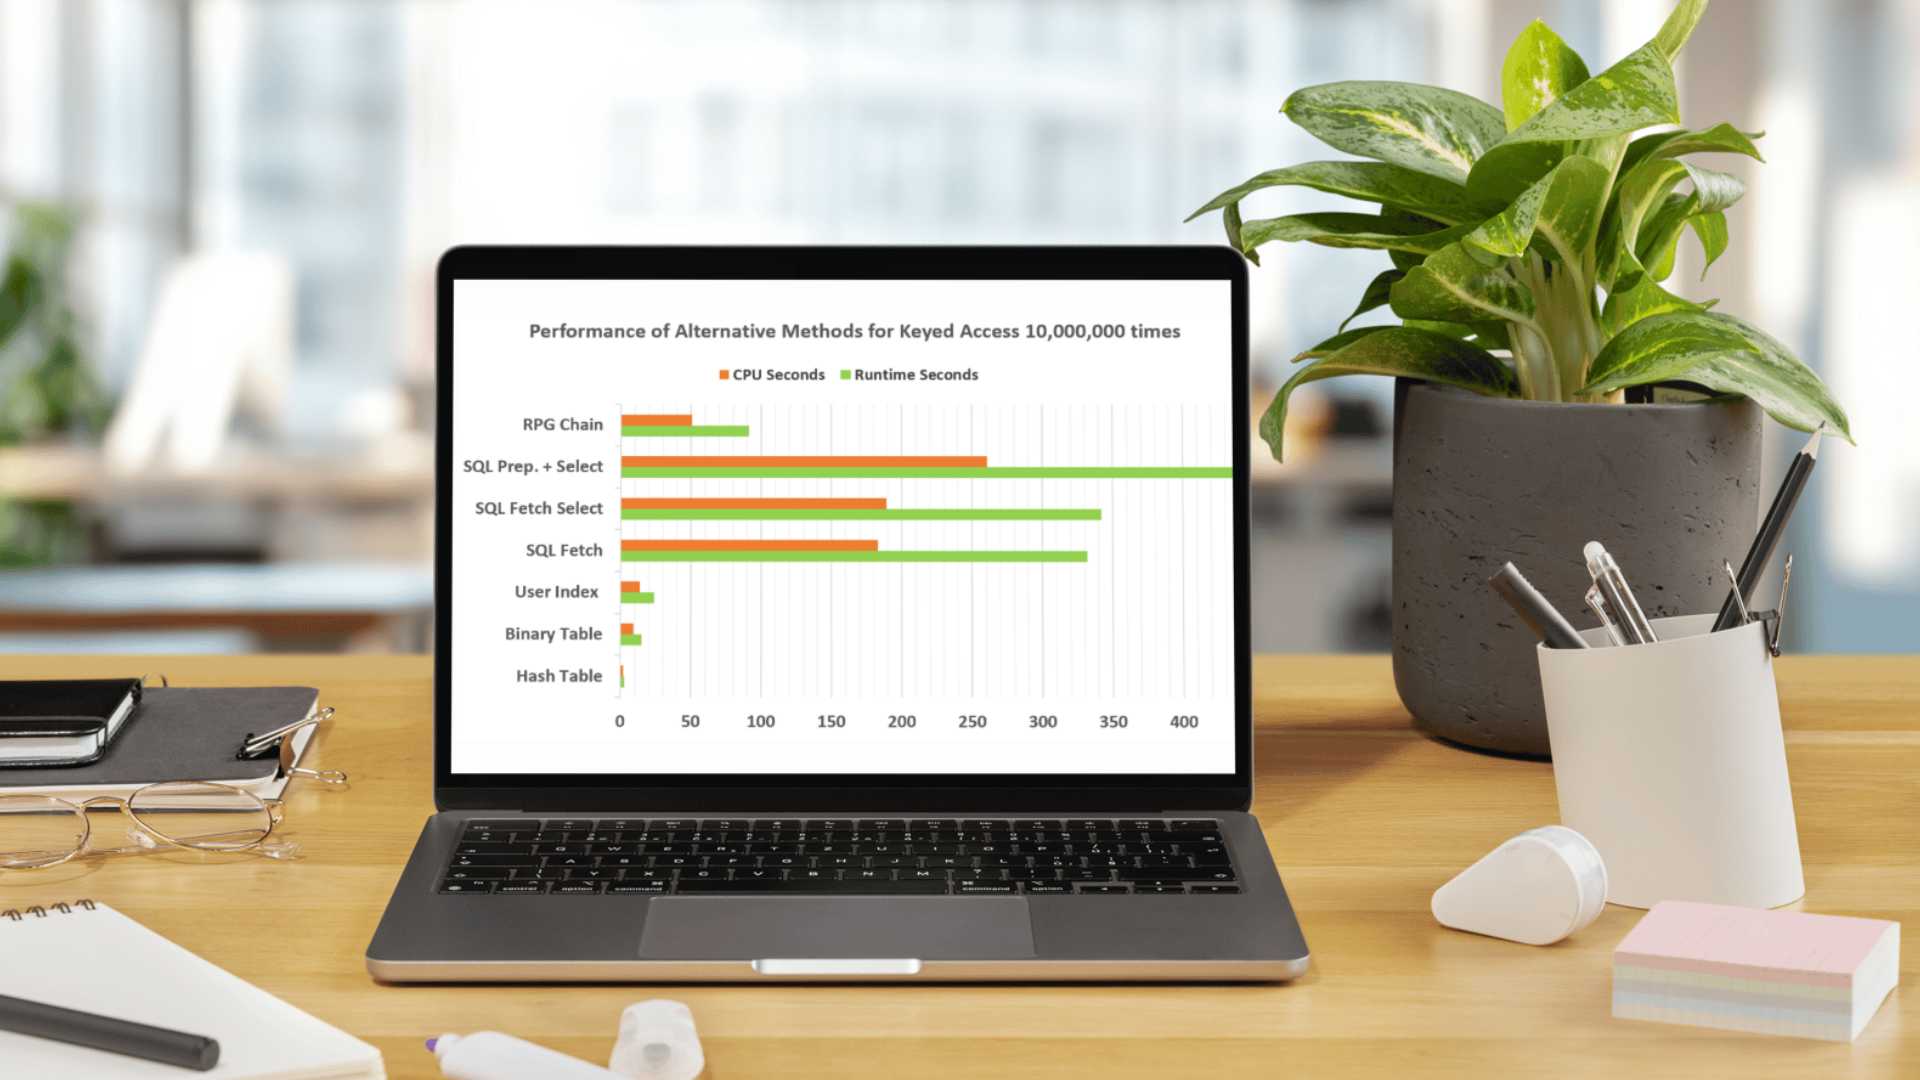
You can access a user space without involving any I/Os via a pointer obtained using the QUSPRTUS API. Our tests run doing 100.000 both updates and reads show that a data area is 196 times slower than a user space.”
User spaces are normal permanent objects. You can save and restore them like any other object, and they can be shared across jobs (given the right authority).
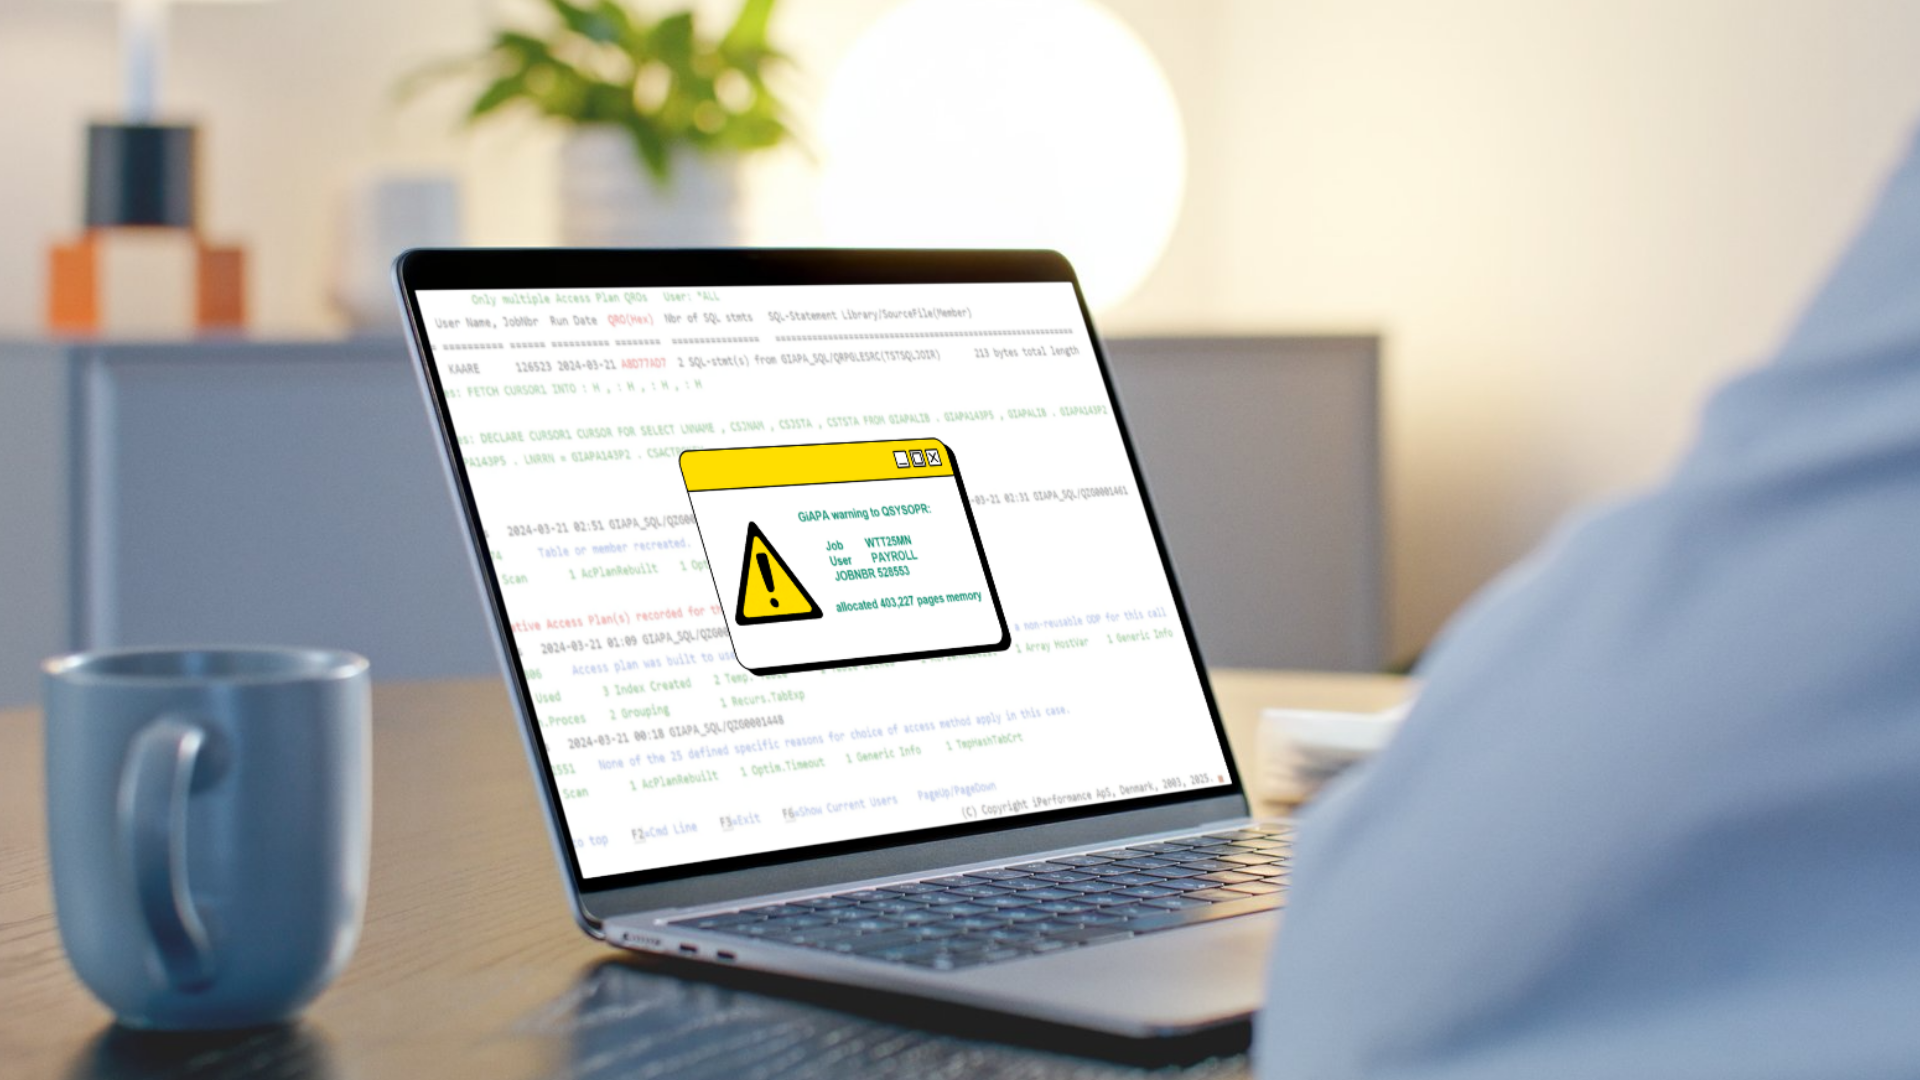
GiAPA automatically flags inefficient data area usage by analyzing the call stacks of CPU-intensive jobs. You can also identify data area activity yourself:
QCLRTVDA, QWCCCHVC, QWCCCRVC, QWCCDSVC, QWCRDTAA or QWCSRTVR can be signs of performance bottlenecks due to data area use.
If you’re aiming for better system performance and still rely on very frequent use of data areas, now is a great time to explore user spaces. It’s a simple switch that could save you serious CPU—and help your applications scale more efficiently.
In this section, you'll find in-depth articles, practical tips, and real-world experiences aimed at helping system administrators and IT decision-makers improve performance, reduce resource usage, and get more value from their IBM i environments. Whether you're exploring general best practices or diving into specific GiAPA capabilities, our insights are here to guide you. Explore, learn, and optimize.

.png)
In this section, you'll find in-depth articles, practical tips, and real-world experiences aimed at helping system administrators and IT decision-makers improve performance, reduce resource usage, and get more value from their IBM i environments. Whether you're exploring general best practices or diving into specific GiAPA capabilities, our insights are here to guide you. Explore, learn, and optimize.