June 14, 2025
Why FIFO isn’t Always FIFO: Lessons from User Queues on Power i
This is some text inside of a div block.


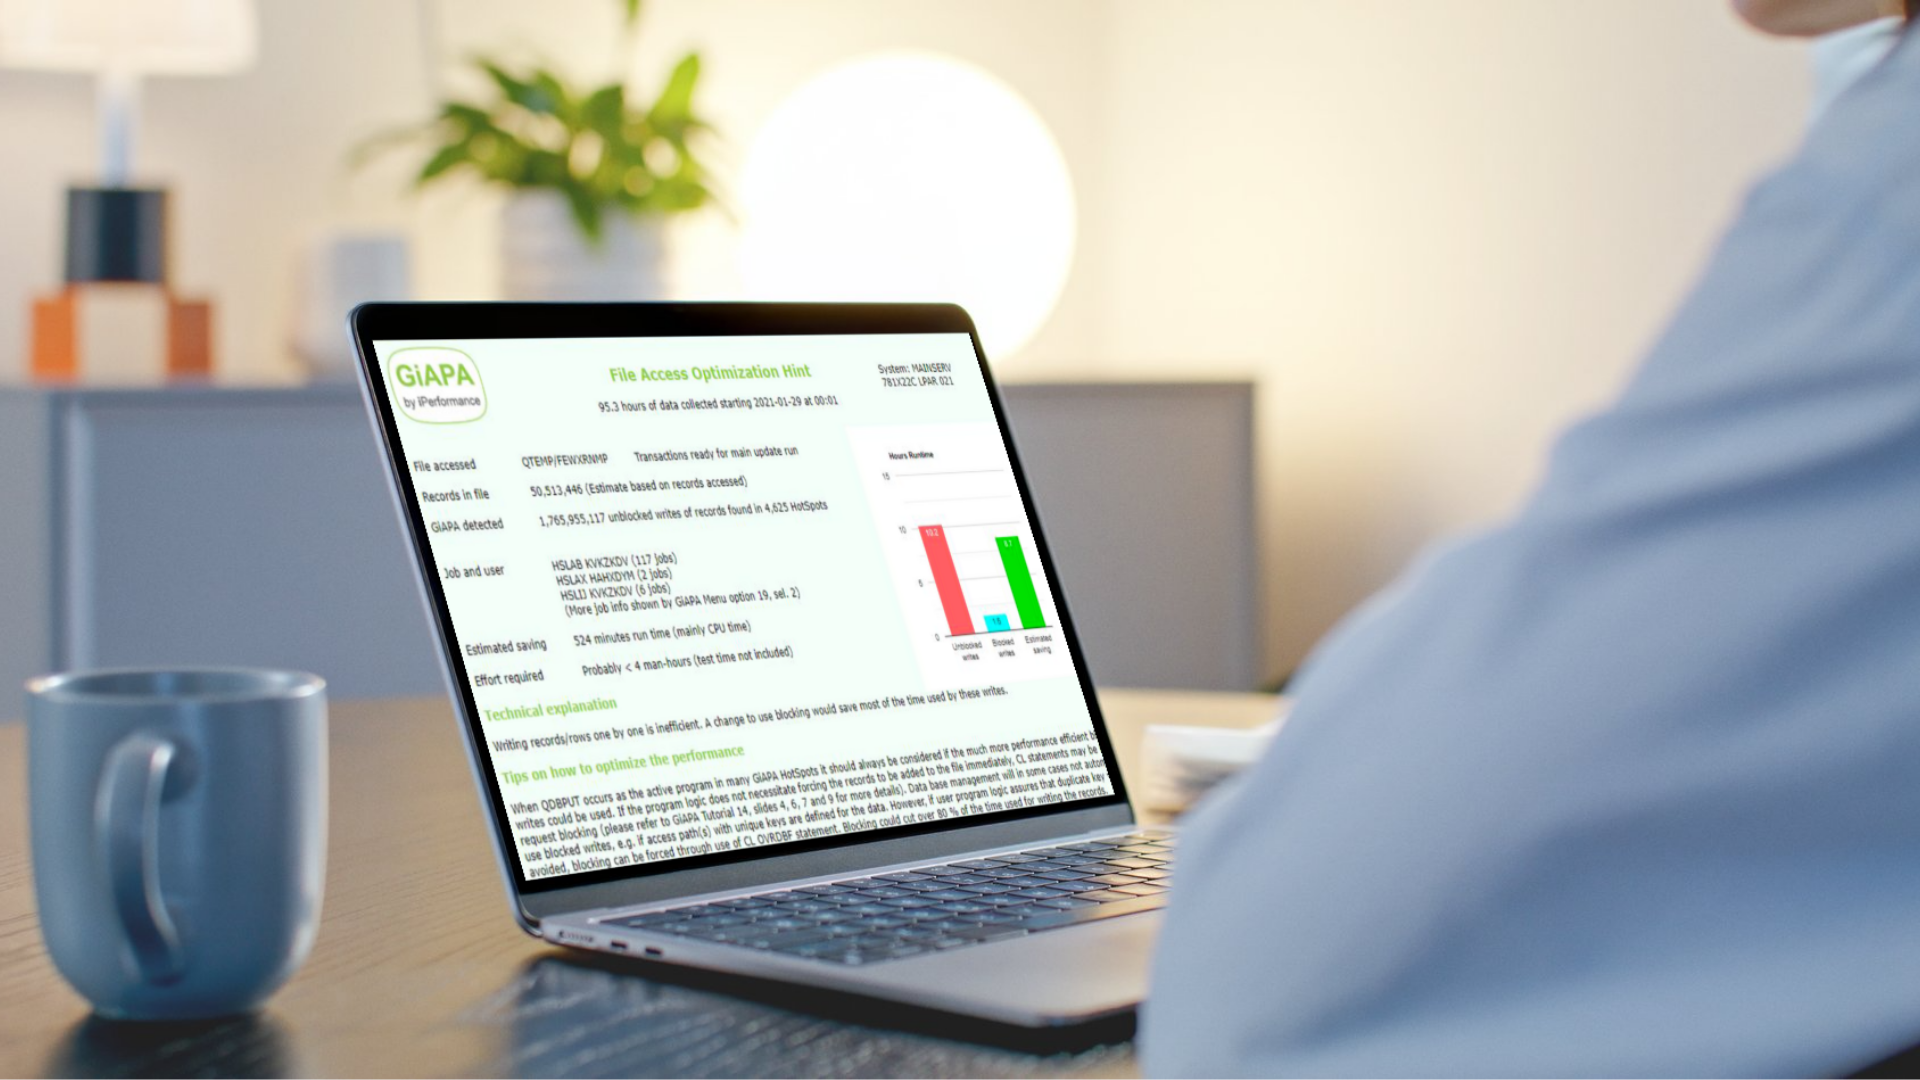
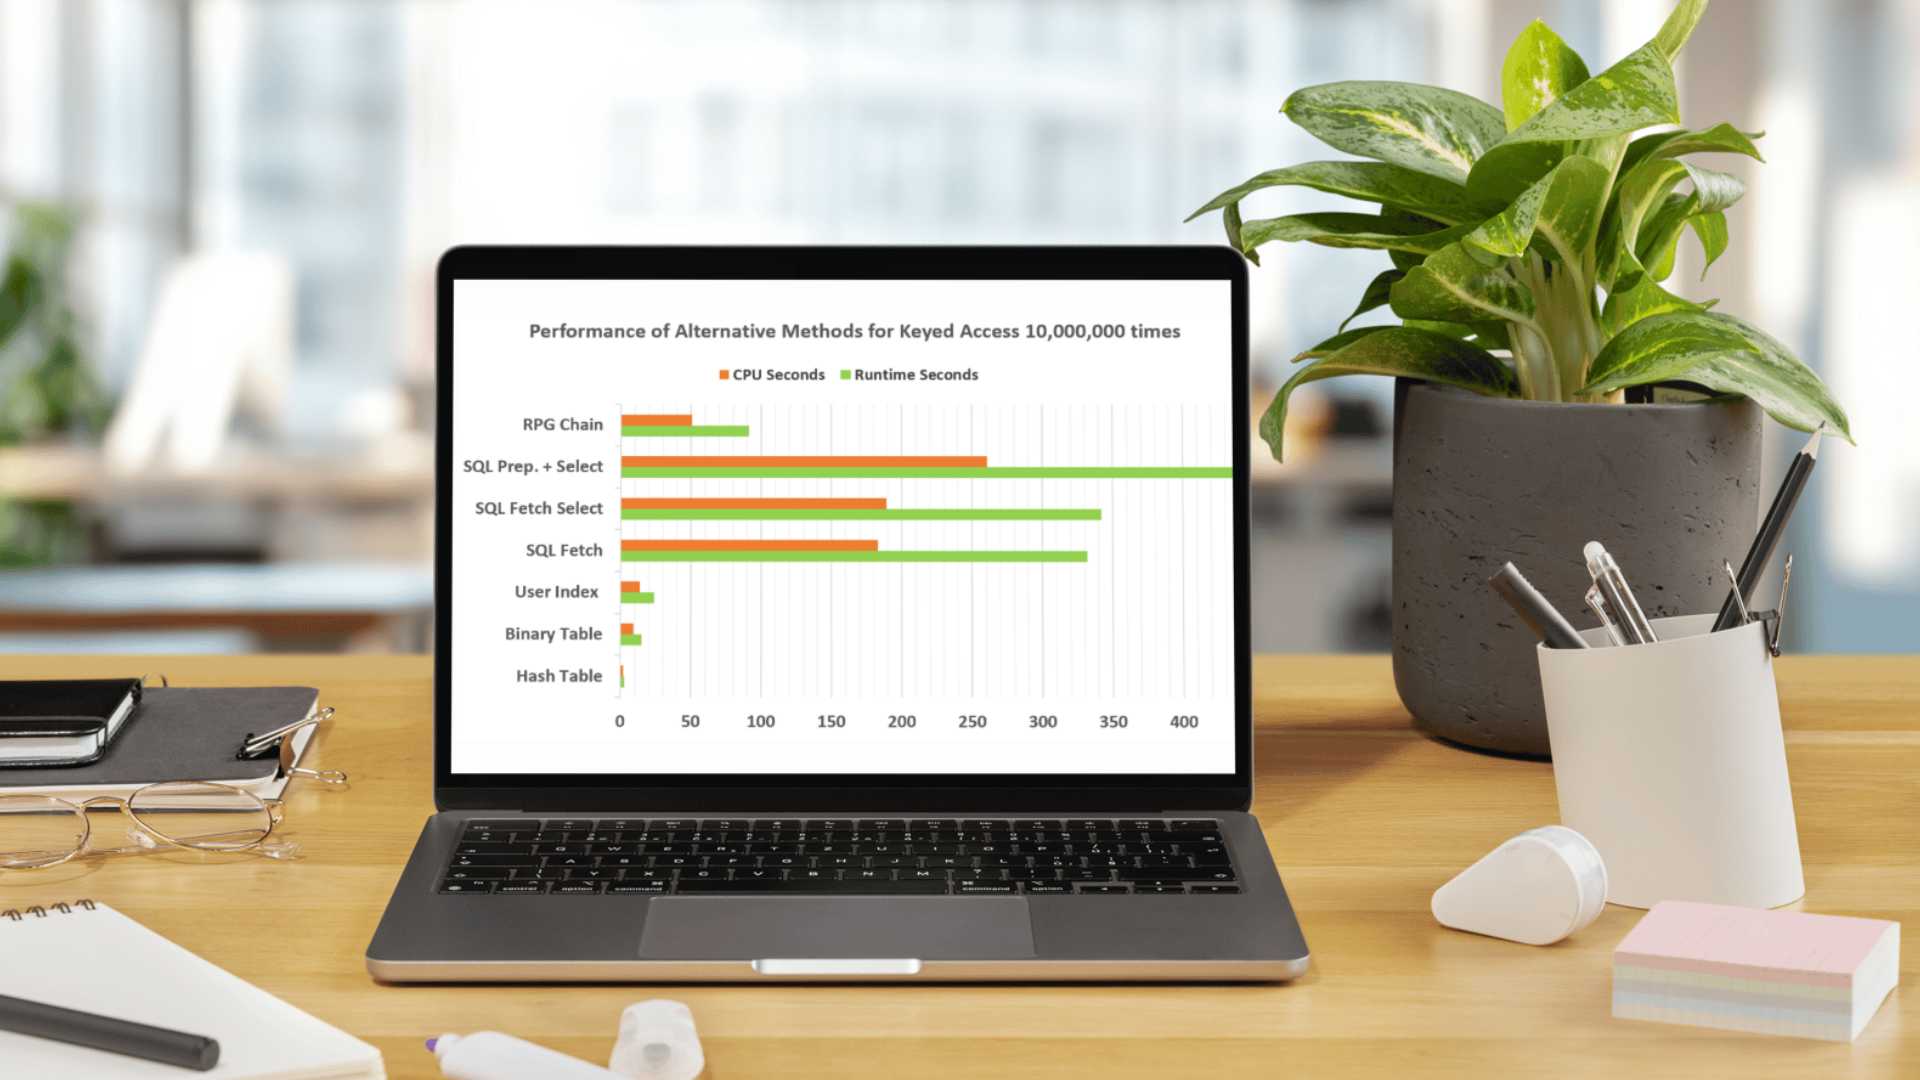
Developers often rely on assumptions when troubleshooting performance issues. But what if you could see exactly which programs, routines, and even source line numbers are consuming the most resources and what the resources are used for?
That’s what GiAPA’s Triple A feature — Automatic Application Analysis — delivers.
Instead of digging through logs or adding debug code, developers get immediate answers:
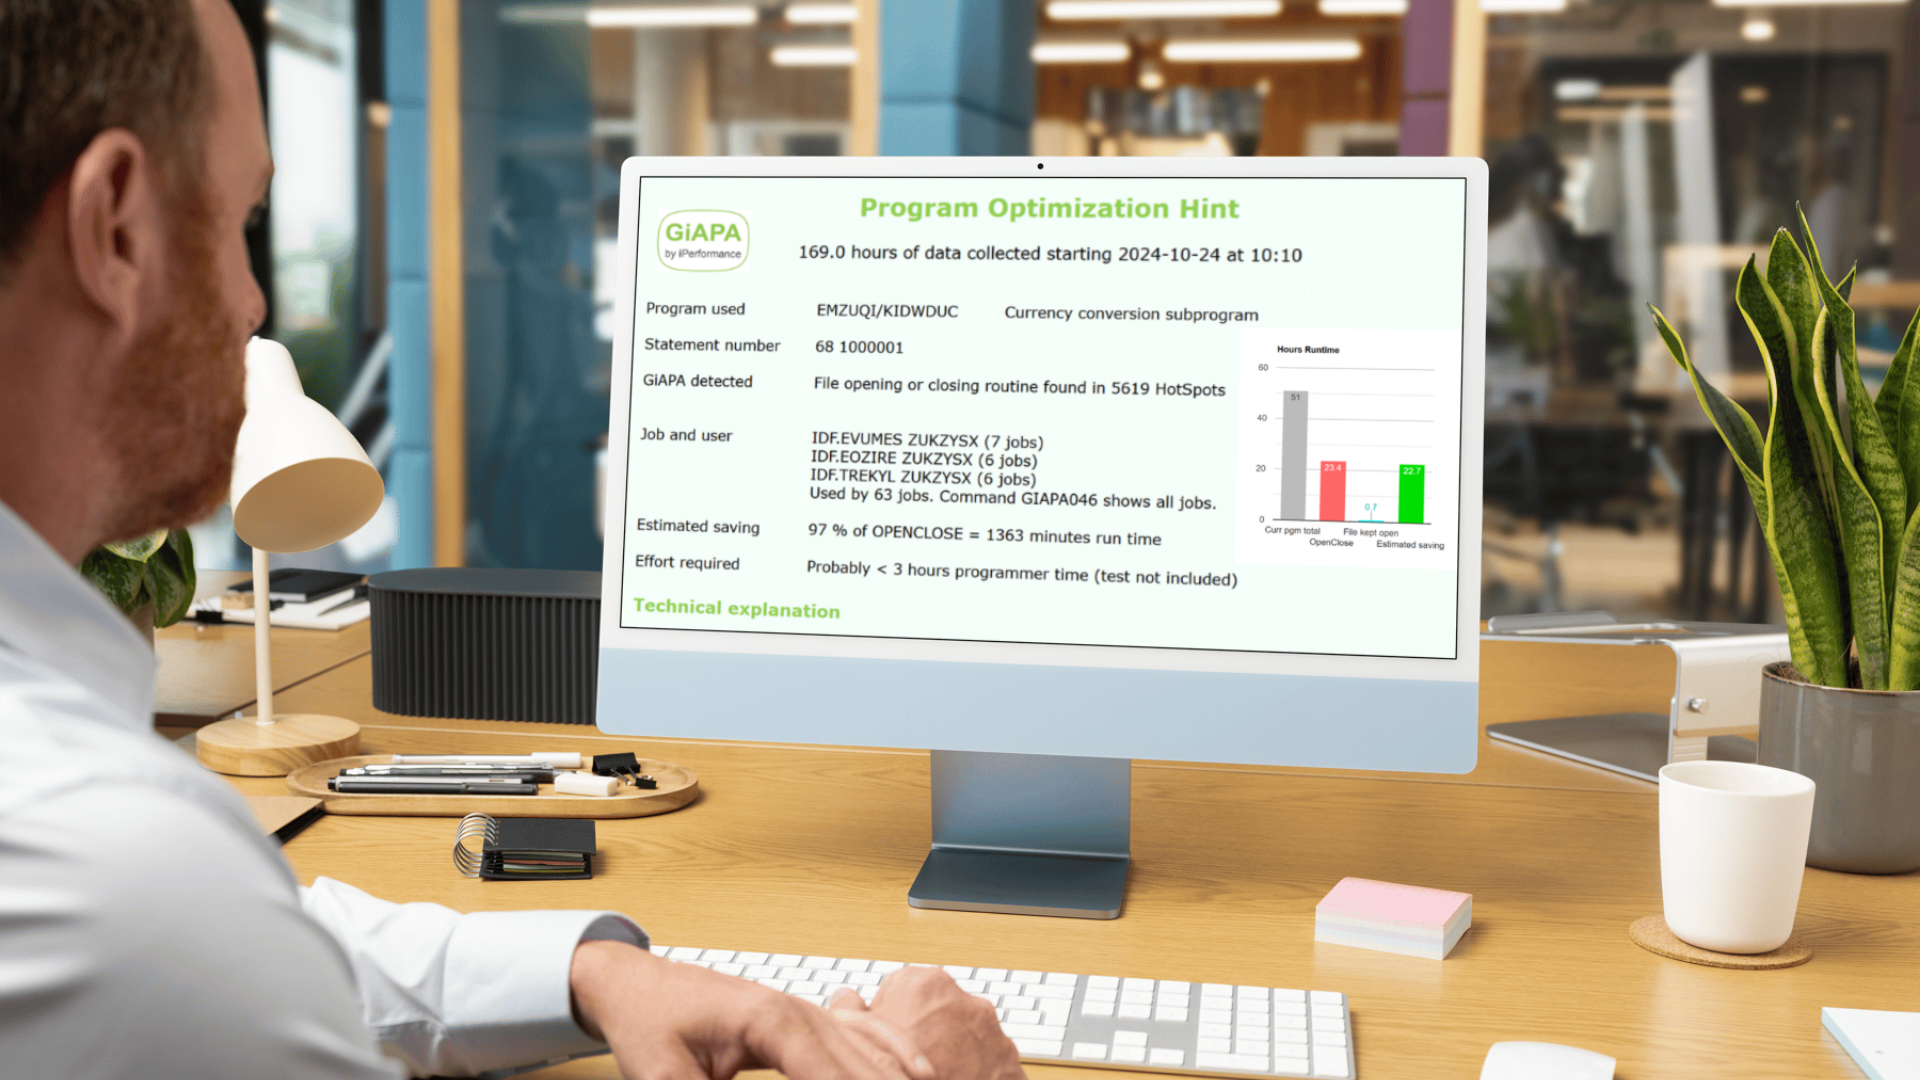
This detailed data collection is automatically used for CPU-intensive jobs, and the data is stored for easy comparison. The result? Developers spend less time guessing and more time improving.
Triple A isn’t just a time-saver — it turns ordinary programmers into performance experts, giving them the confidence to optimize with precision.
And because this insight is integrated into the same tool used by operations and management, everyone gets to work from the same data.
GiAPA’s Triple A feature gives developers unprecedented insight into how their code performs — helping them write faster, leaner, and smarter programs from day one.
In this section, you'll find in-depth articles, practical tips, and real-world experiences aimed at helping system administrators and IT decision-makers improve performance, reduce resource usage, and get more value from their IBM i environments. Whether you're exploring general best practices or diving into specific GiAPA capabilities, our insights are here to guide you. Explore, learn, and optimize.

.png)
In this section, you'll find in-depth articles, practical tips, and real-world experiences aimed at helping system administrators and IT decision-makers improve performance, reduce resource usage, and get more value from their IBM i environments. Whether you're exploring general best practices or diving into specific GiAPA capabilities, our insights are here to guide you. Explore, learn, and optimize.