June 14, 2025
Why FIFO isn’t Always FIFO: Lessons from User Queues on Power i
This is some text inside of a div block.


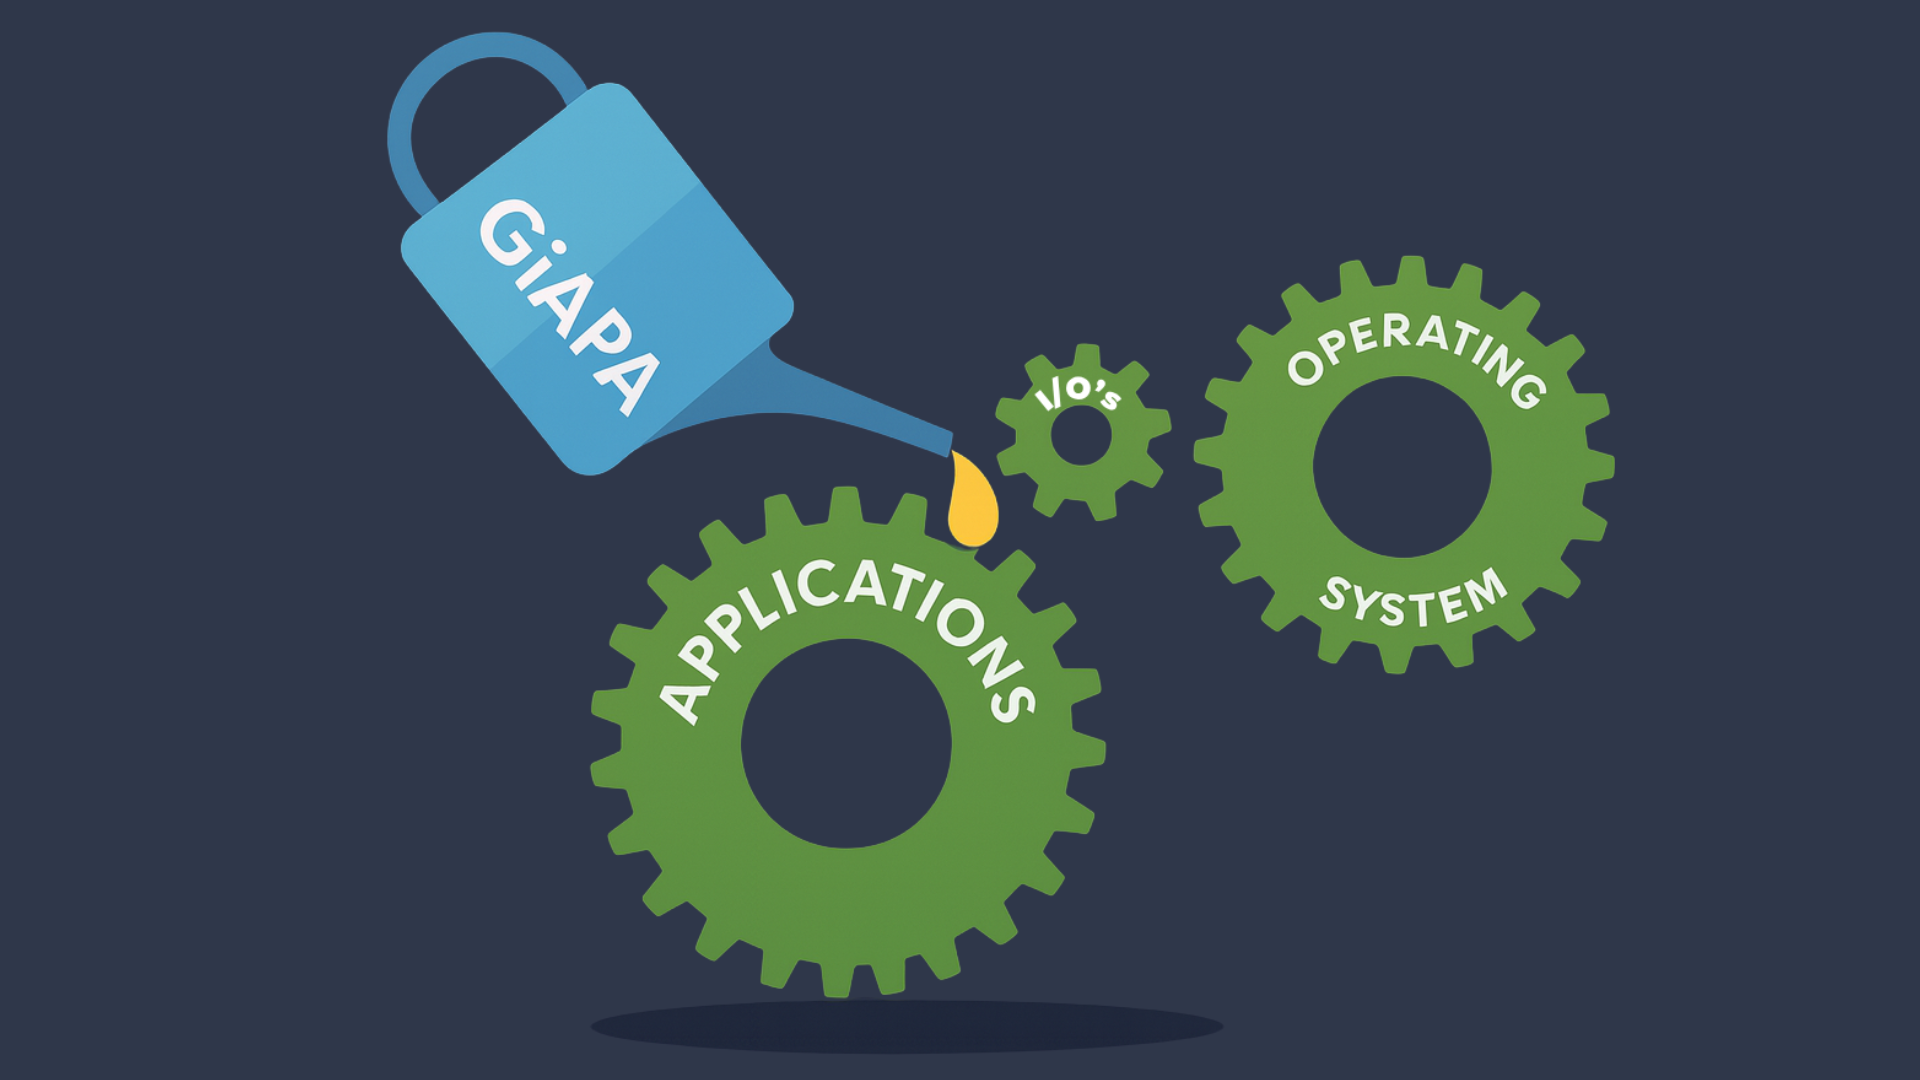
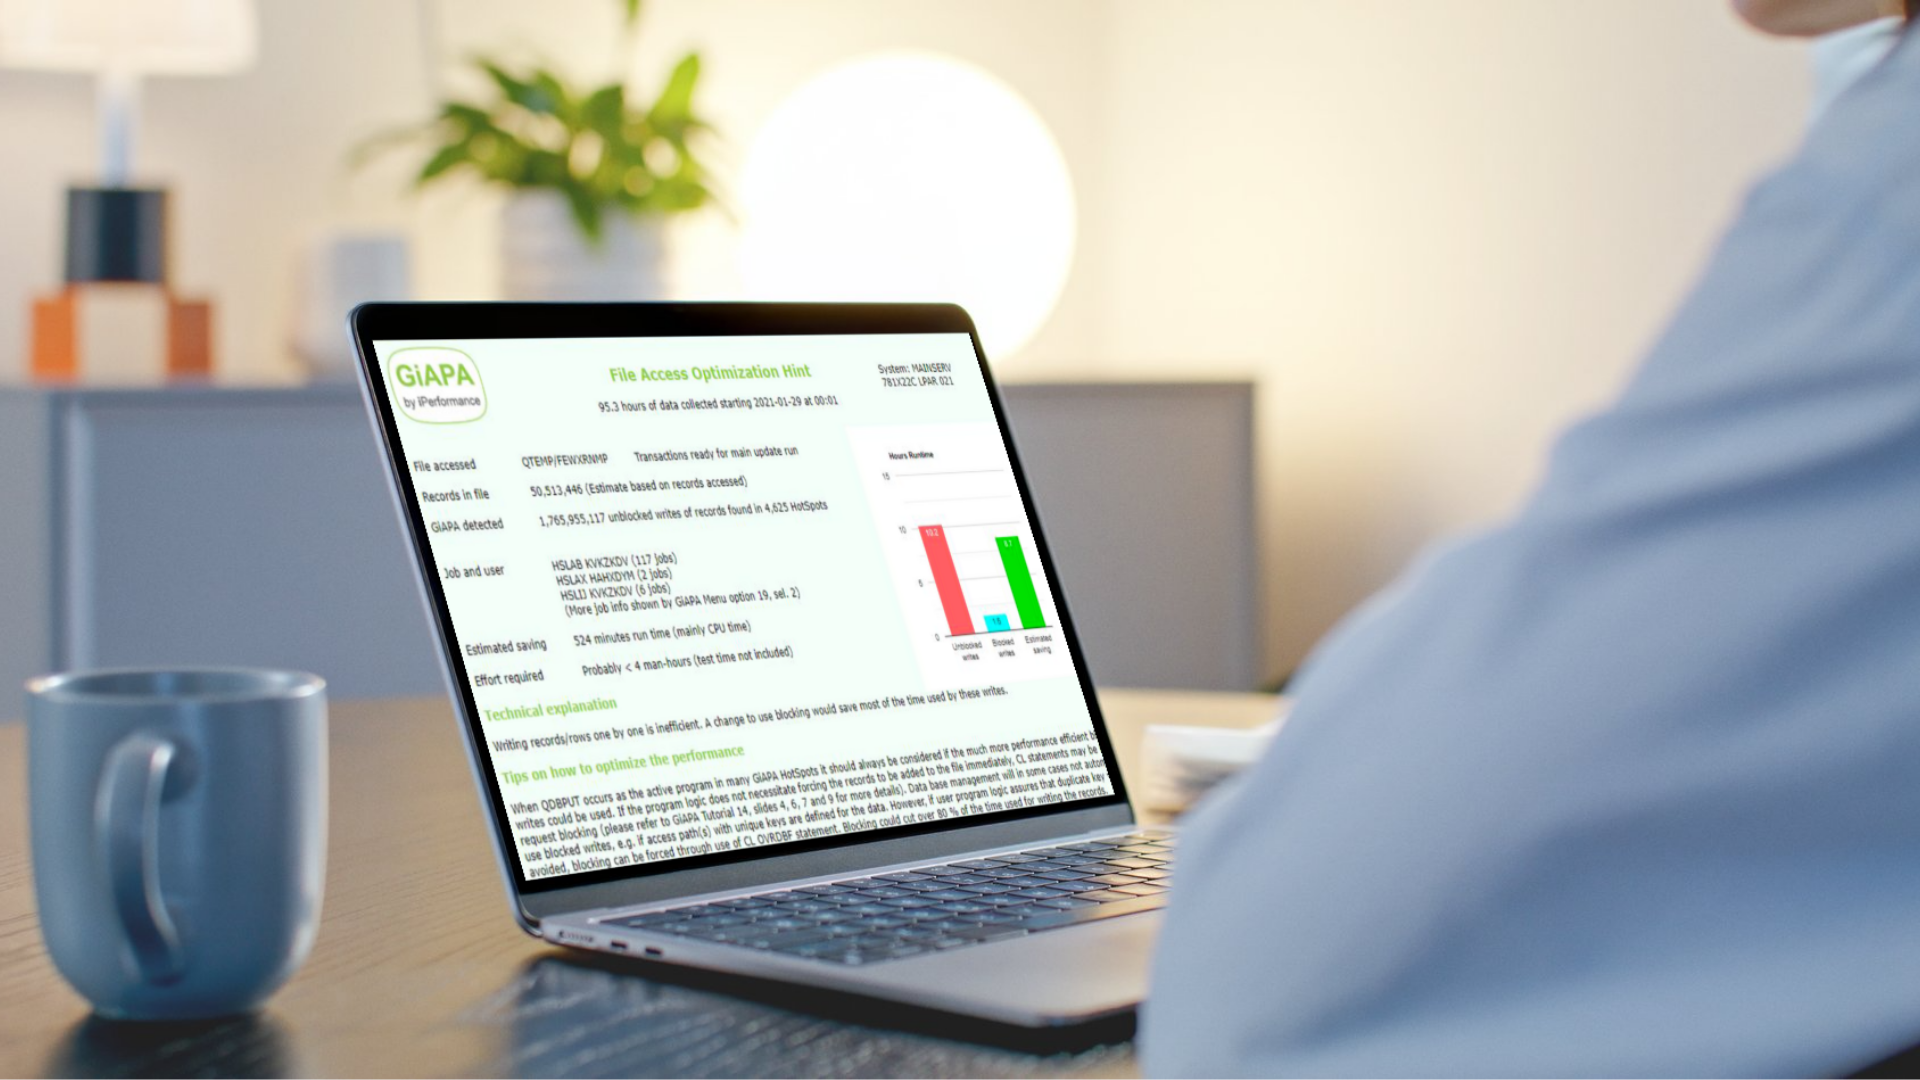
Some tools require days of setup before you see any value. GiAPA isn’t one of them. Installation takes only minutes, and collection of data can start immediately. Data is normally collected 24/7, however, analysis of the data is possible even while data collection is running, after which details disclosing where resources were used and for what purpose can be seen per job or active program.
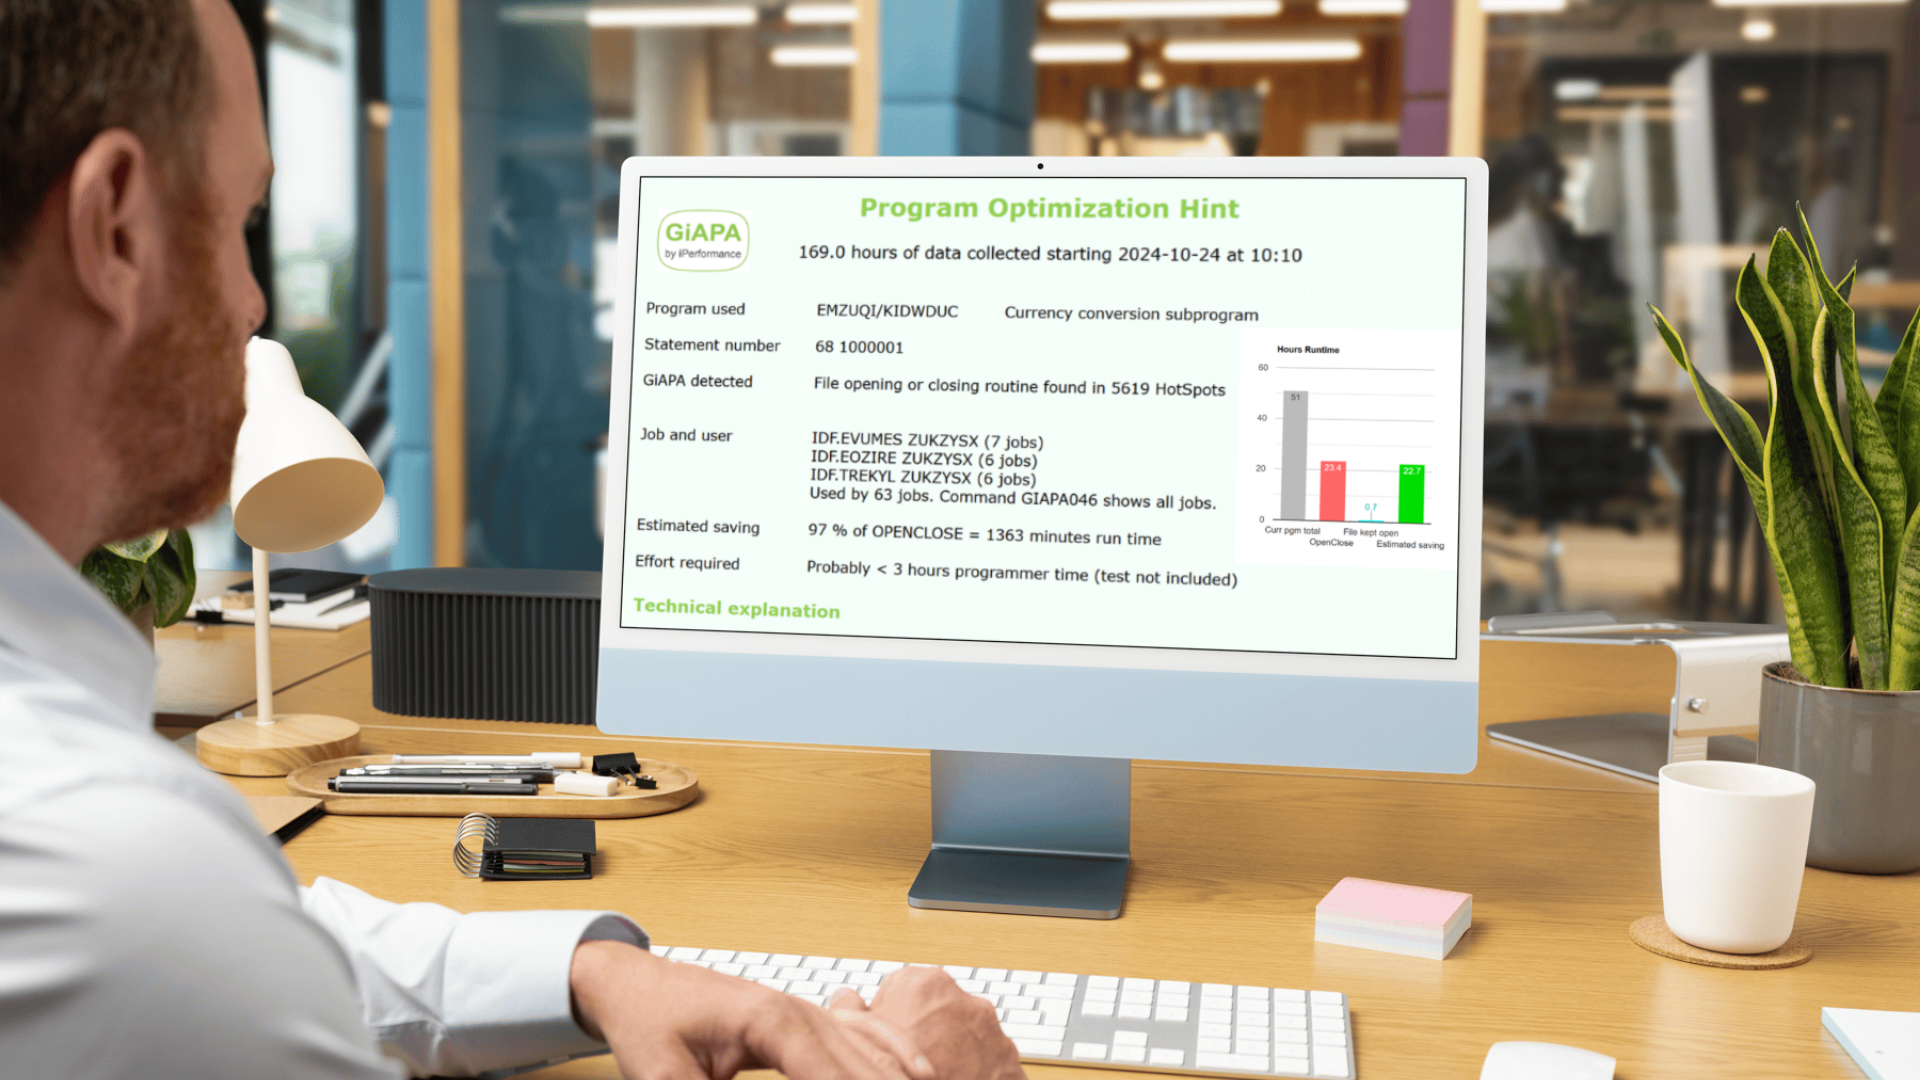
This isn’t just about visibility — it’s about clarity. You don’t need to know where to look or what to ask. GiAPA surfaces what matters most.
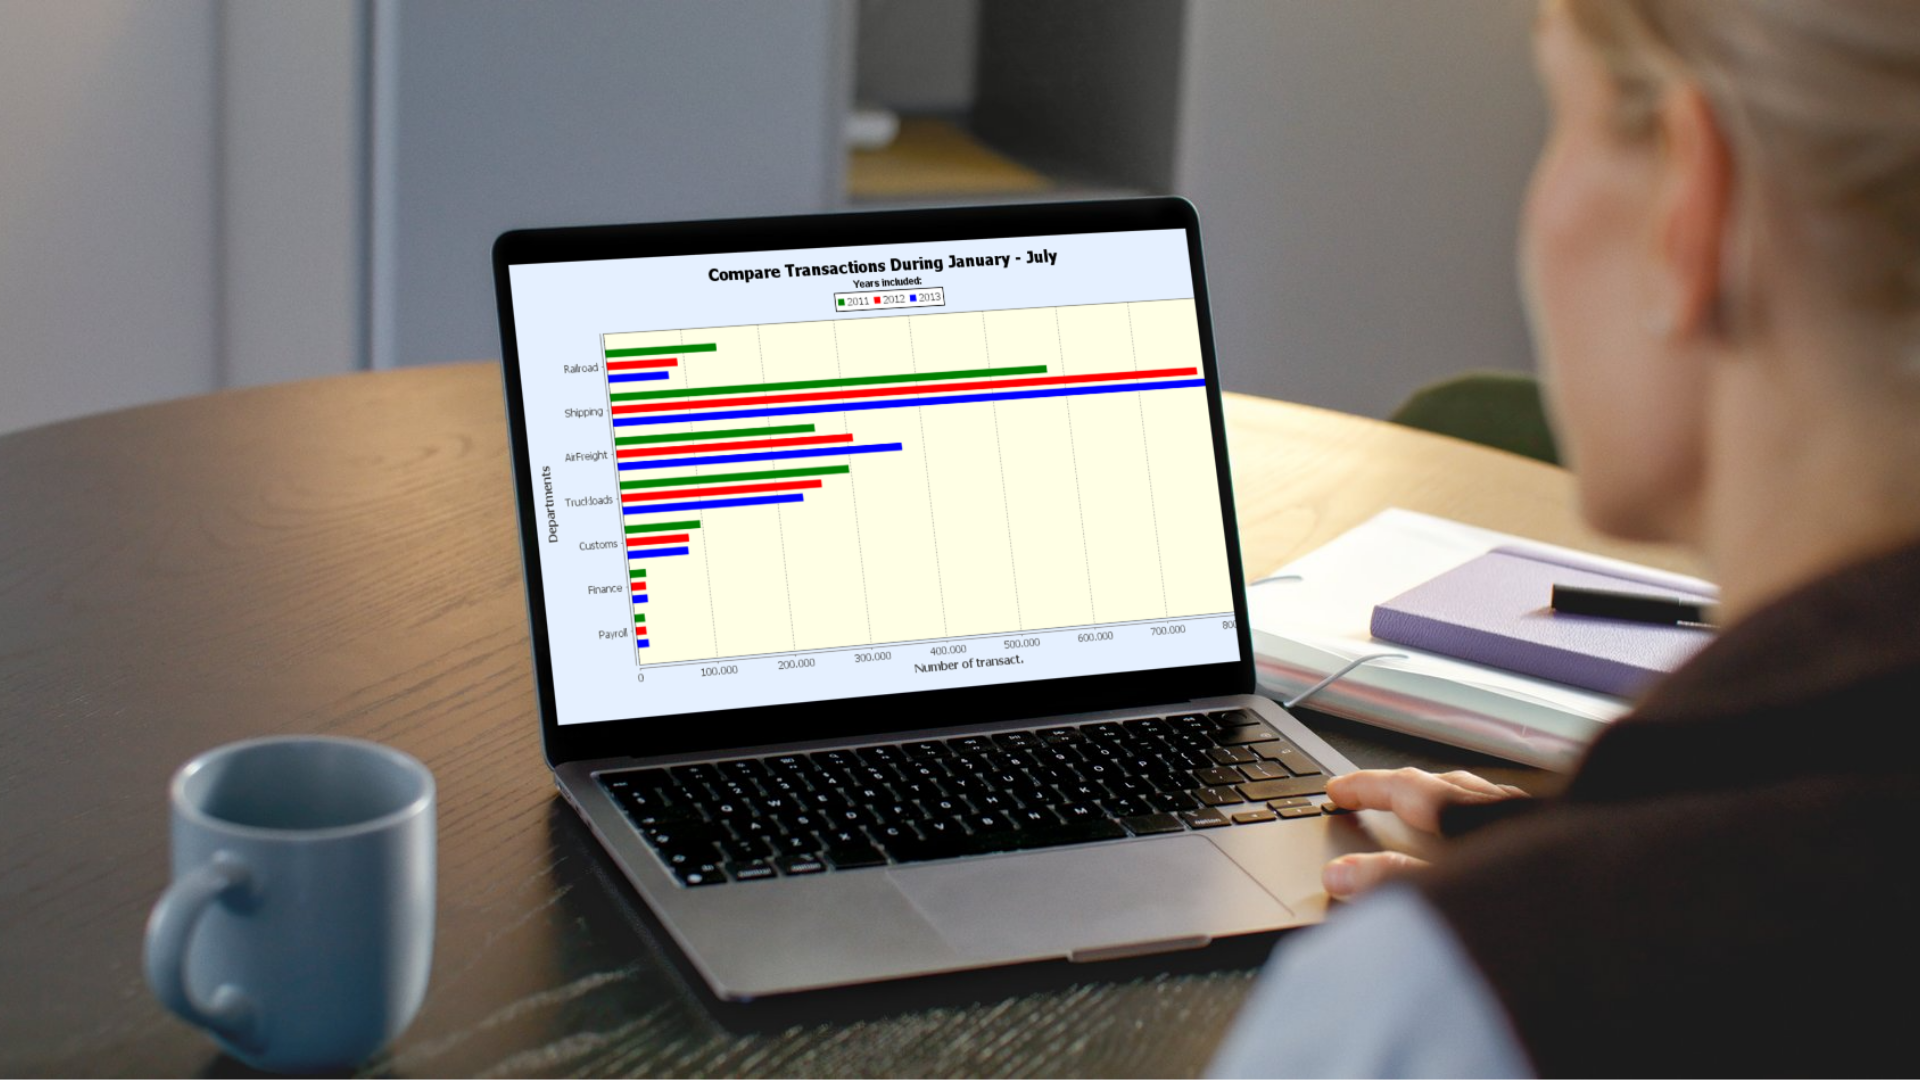
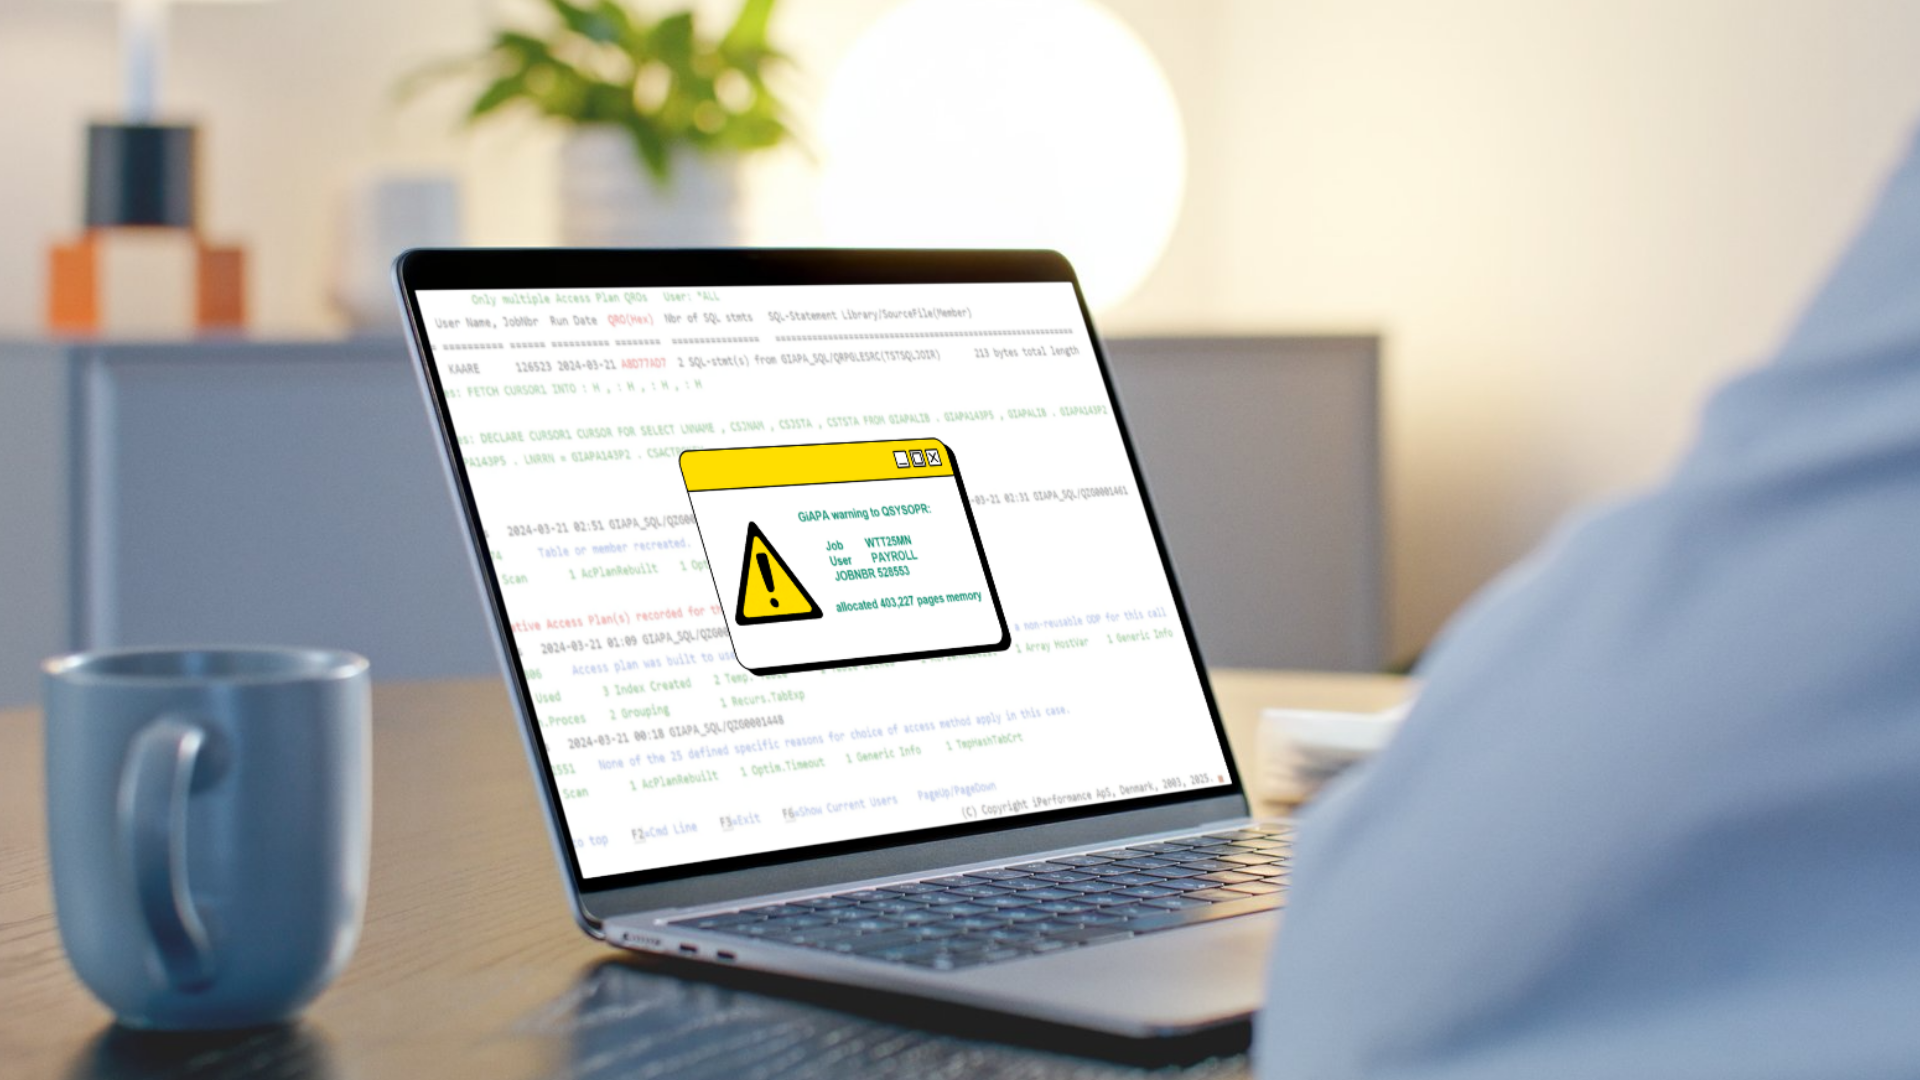
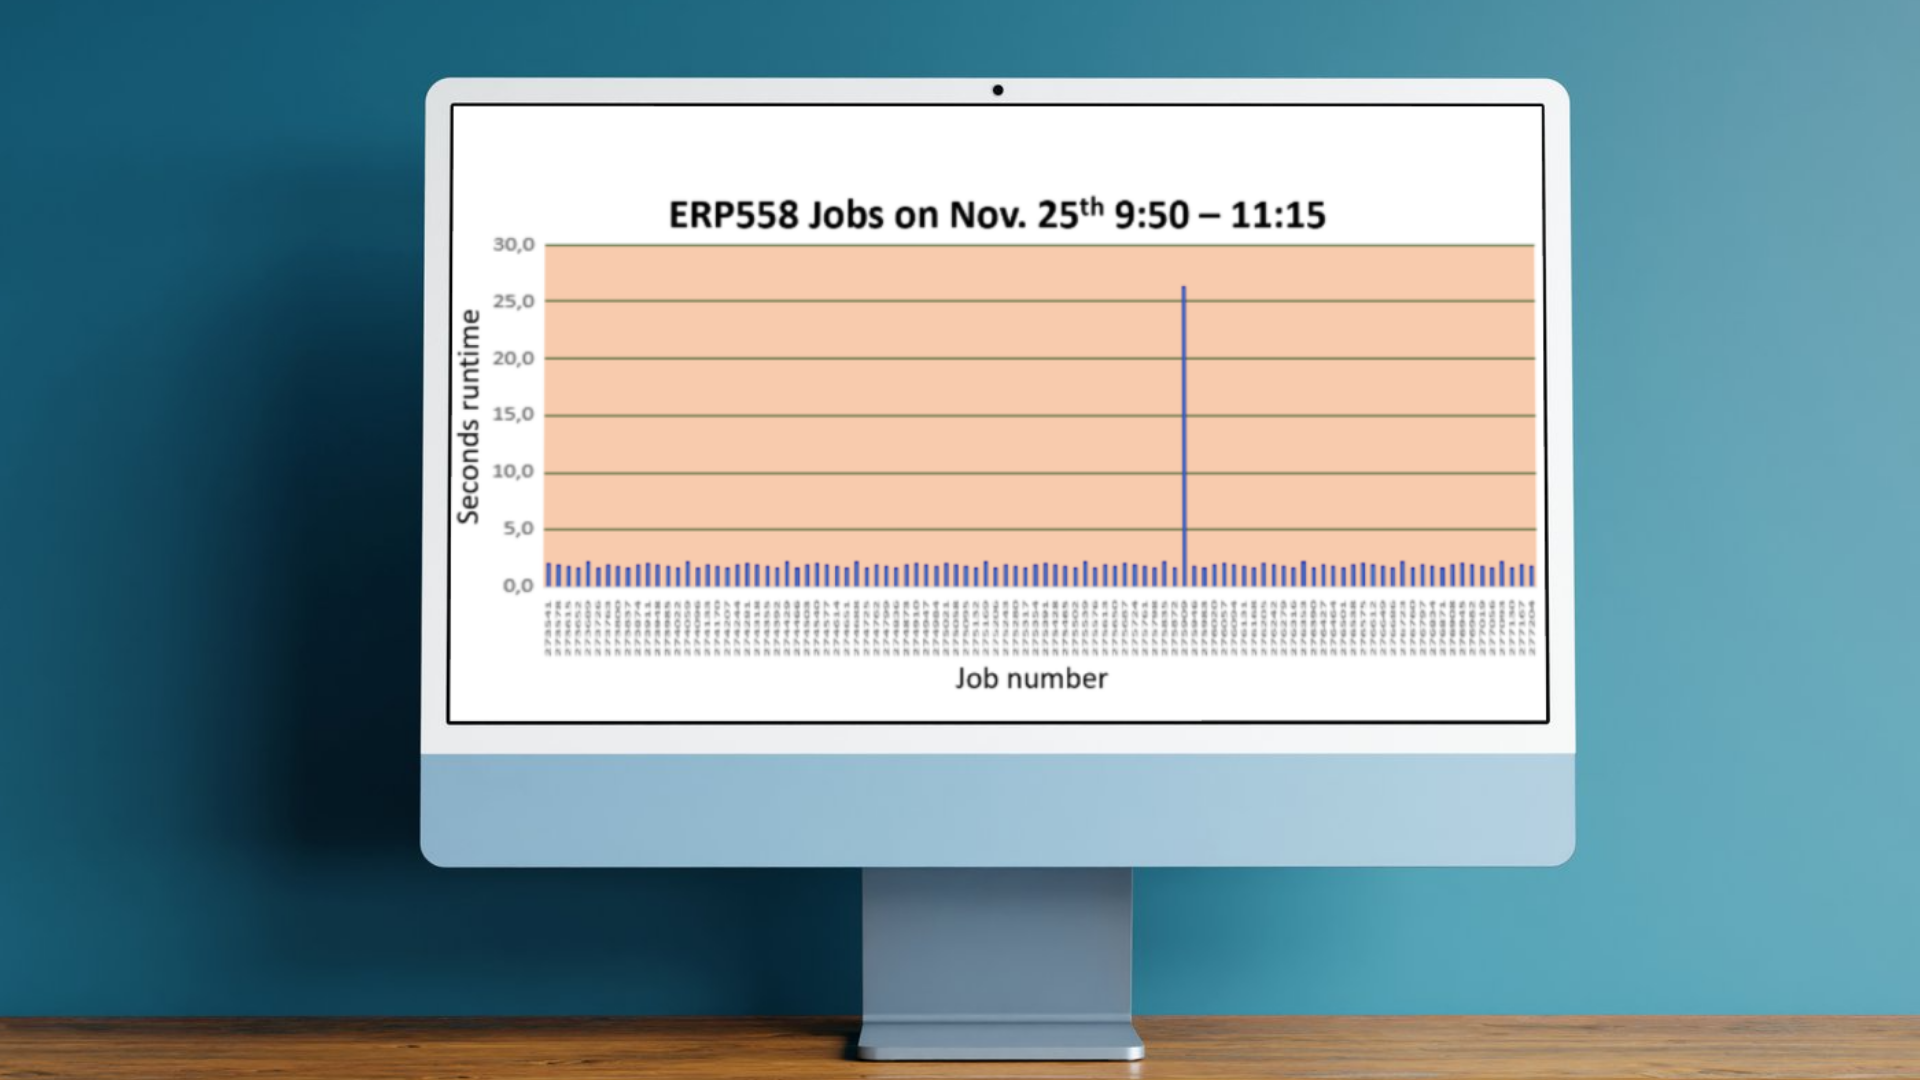
It’s especially eye-opening for new users. Many find out in their first session that a long-running batch job is eating up far more resources than anyone expected. Or that a few ad-hoc SQL queries are quietly hogging system capacity.
Whether you’re in operations, development, or management, GiAPA starts working for you from the first five minutes.
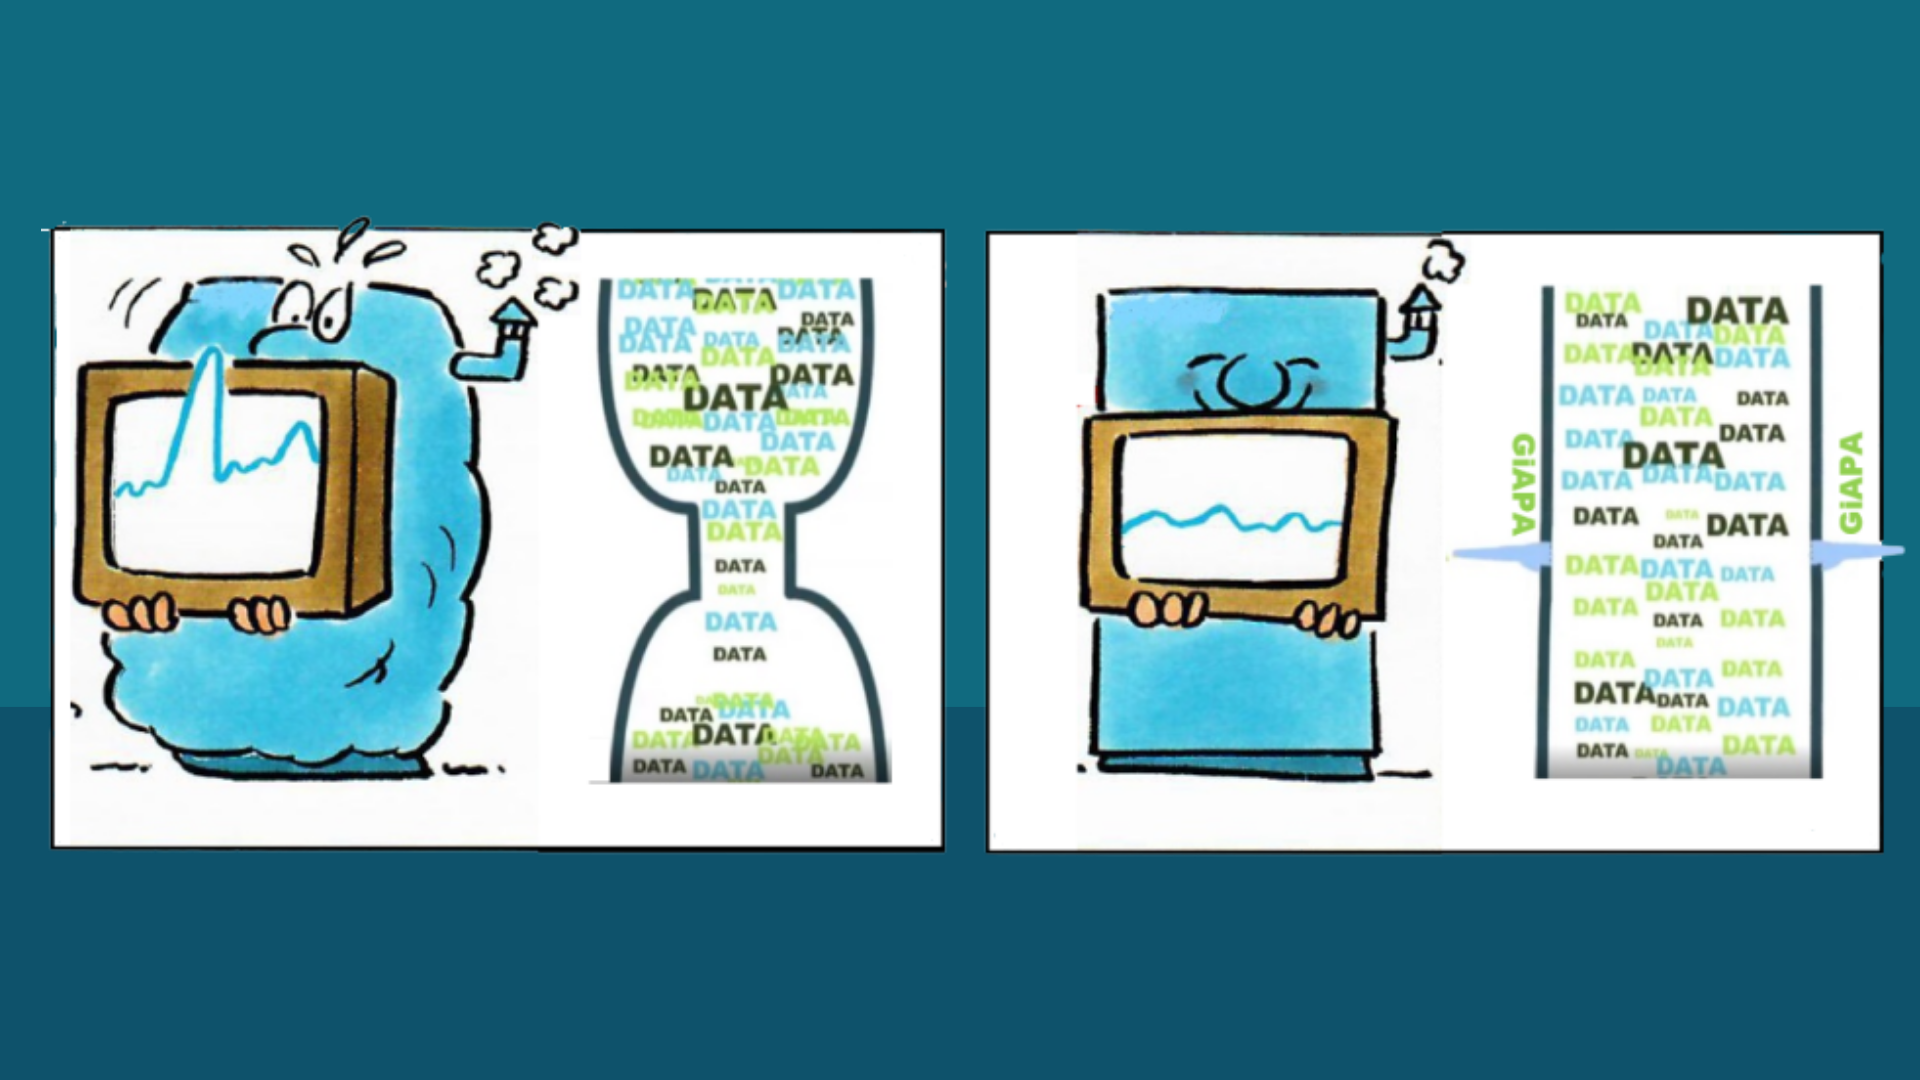
GiAPA doesn’t just collect data — it highlights what’s important, right away. No steep learning curve, no weeks of tuning. Just immediate insight into how your system is really being used.
In this section, you'll find in-depth articles, practical tips, and real-world experiences aimed at helping system administrators and IT decision-makers improve performance, reduce resource usage, and get more value from their IBM i environments. Whether you're exploring general best practices or diving into specific GiAPA capabilities, our insights are here to guide you. Explore, learn, and optimize.

.png)
In this section, you'll find in-depth articles, practical tips, and real-world experiences aimed at helping system administrators and IT decision-makers improve performance, reduce resource usage, and get more value from their IBM i environments. Whether you're exploring general best practices or diving into specific GiAPA capabilities, our insights are here to guide you. Explore, learn, and optimize.