June 14, 2025
Why FIFO isn’t Always FIFO: Lessons from User Queues on Power i
This is some text inside of a div block.


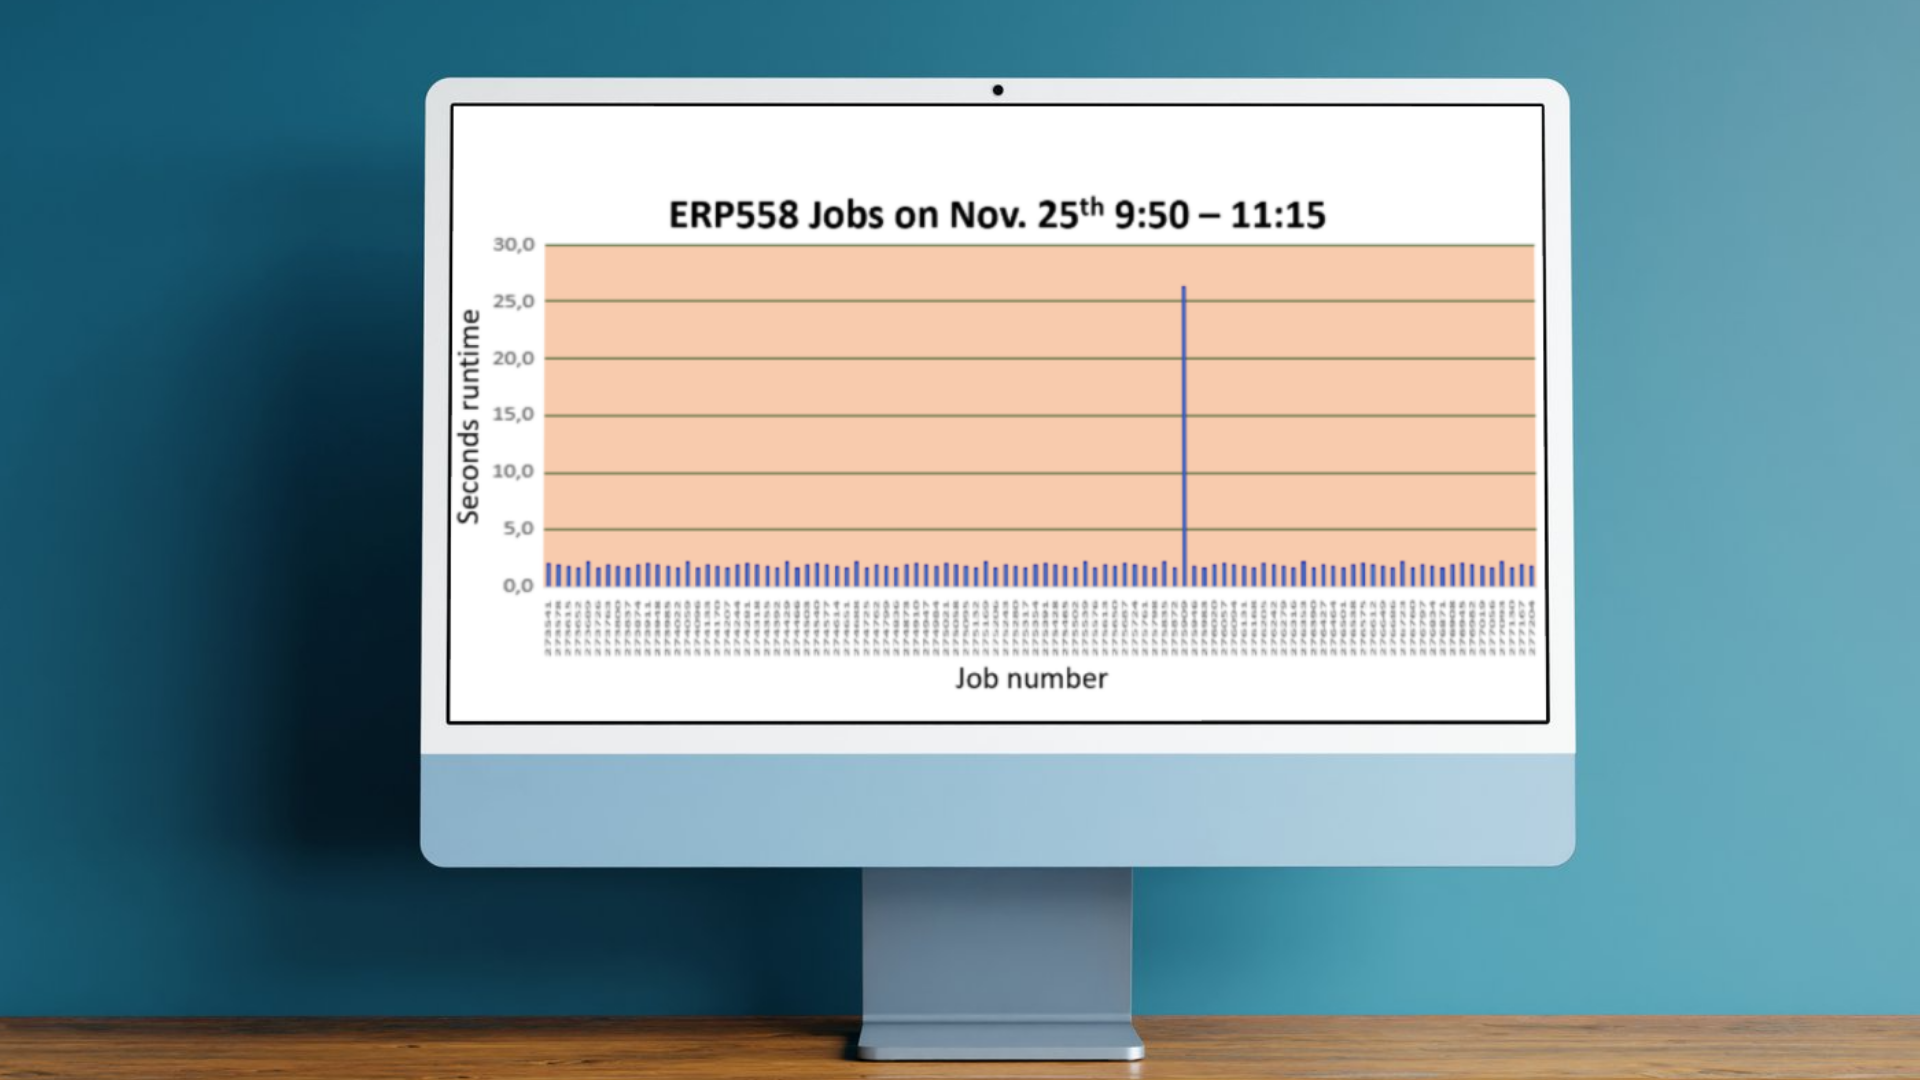
One of our users contacted us with a puzzling issue: several very small jobs, each running once a minute and typically completing in 1–2 seconds, would occasionally take 30 seconds or more to return a result.
The delay happened so rarely—and the jobs ended normally and delivered correct results—that operations couldn’t catch them in time to investigate. Something was clearly causing the job to wait, but what?
In cases like this, the best way to diagnose the issue is to retrieve the job’s call stack while the delay is happening. Our performance analysis tool GiAPA includes a “Watch job” function for precisely this purpose, but you can also set up a lightweight workaround using just a few lines of CL code.
Here’s how it works:
RTVJOBA and SBMJOB
RTVJOBA JOB(&NAME) USER(&USER) NBR(&NBR)
SBMJOB CMD(CALL PGM(WATCHCL)) JOBQ(QINTER) JOB(WATCH_DELAY)
WATCHCL program:DLYJOB DLY(10)
DSPJOB JOB(&NBR/&USER/&NAME) OPTION(*PGMSTK)
MONMSG CPF0000
DLYJOB DLY(10) ensures the analysis job waits until after the tiny job should have finished.DSPJOB ... OPTION(*PGMSTK) prints the call stack if the job is still running.MONMSG CPF0000 prevents errors if the job already ended (which it normally will, unless it’s delayed).This setup lets you quietly “watch” the job from the side, without affecting its behavior. And if a delay does occur, you’ll get a snapshot of what the job was doing at that moment—including which program or statement was active.
This method is especially useful for rare, unpredictable delays where the job exits cleanly before anyone can inspect it. With this in place, you’ll have a clear view of any resource the job was waiting on—whether it’s file locks, communication with another process, or system contention.
In this section, you'll find in-depth articles, practical tips, and real-world experiences aimed at helping system administrators and IT decision-makers improve performance, reduce resource usage, and get more value from their IBM i environments. Whether you're exploring general best practices or diving into specific GiAPA capabilities, our insights are here to guide you. Explore, learn, and optimize.

.png)
In this section, you'll find in-depth articles, practical tips, and real-world experiences aimed at helping system administrators and IT decision-makers improve performance, reduce resource usage, and get more value from their IBM i environments. Whether you're exploring general best practices or diving into specific GiAPA capabilities, our insights are here to guide you. Explore, learn, and optimize.