.svg)
What Developers Learn from Triple A in Their First Week

June 12, 2025
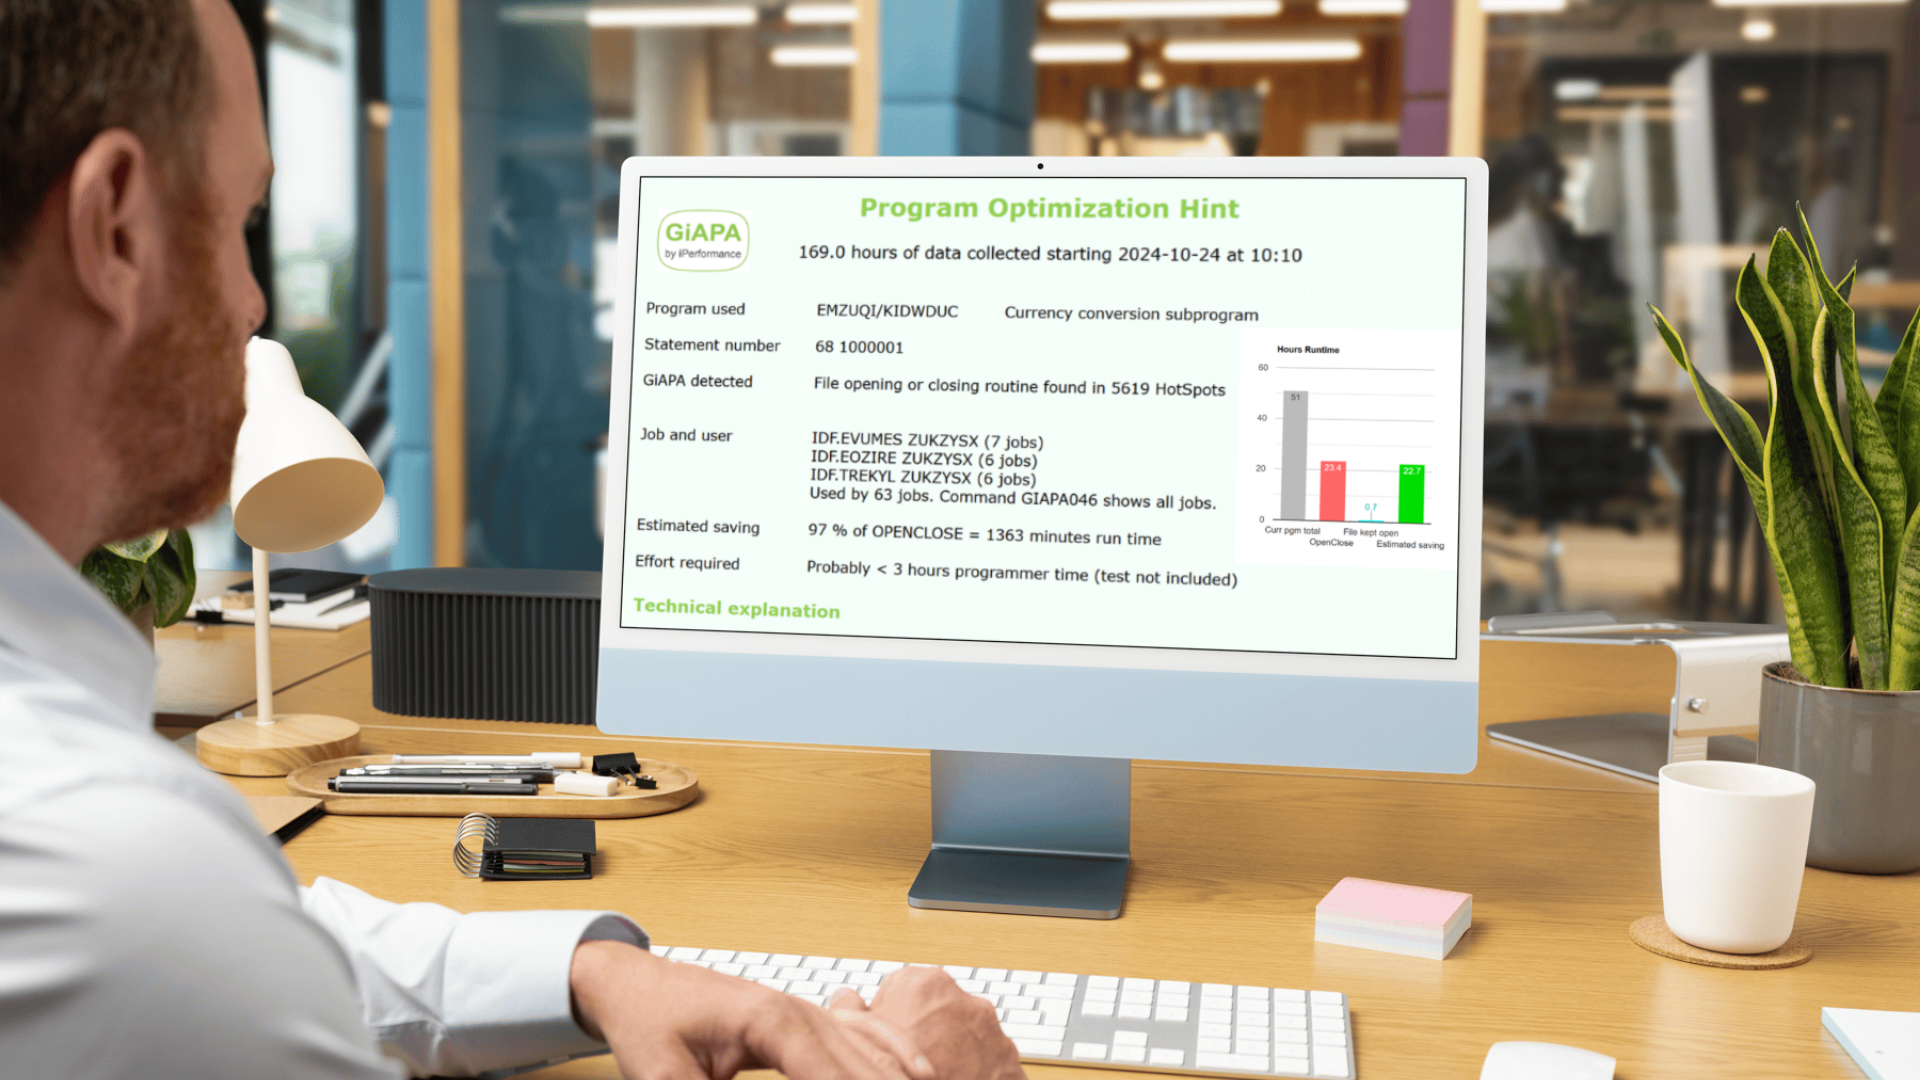
For developers, starting in an environment with GiAPA installed can be a revelation. Within the first week of using the Triple A feature – Automatic Application Analysis – most developers go through the same three reactions:
- “Wait... our code does that?”
Triple A reveals exactly how programs behave in production: which lines of code consume the most CPU, how files are accessed, and where time is lost. Developers often discover unexpected behaviors or redundant logic that went unnoticed in testing. - “How did I not see this before?”
It’s one thing to step through code in a debugger. It’s another to see real-world data showing how programs behave with production volumes, file sizes, and query patterns. Triple A connects the dots between theory and reality. - “I can fix this.”
Equipped with clear performance insights, developers quickly move from guessing to solving. Optimizations that once took weeks of trial and error can now be done in a fraction of the time — with confidence.
And the best part? It’s not just for legacy code. Even newly developed programs benefit from a quick Triple A check before being promoted to production. It's quality assurance for performance, built right into the workflow.
Summary:
Triple A turns developers into performance detectives — fast. By surfacing real usage data down to the source code line, it accelerates learning, improves code quality, and helps teams write smarter software from day one.
.svg)
GiAPA News & Tips
.png)
© 2024 Crowdyflow Agency powered by Webflow