June 14, 2025
Why FIFO isn’t Always FIFO: Lessons from User Queues on Power i
This is some text inside of a div block.


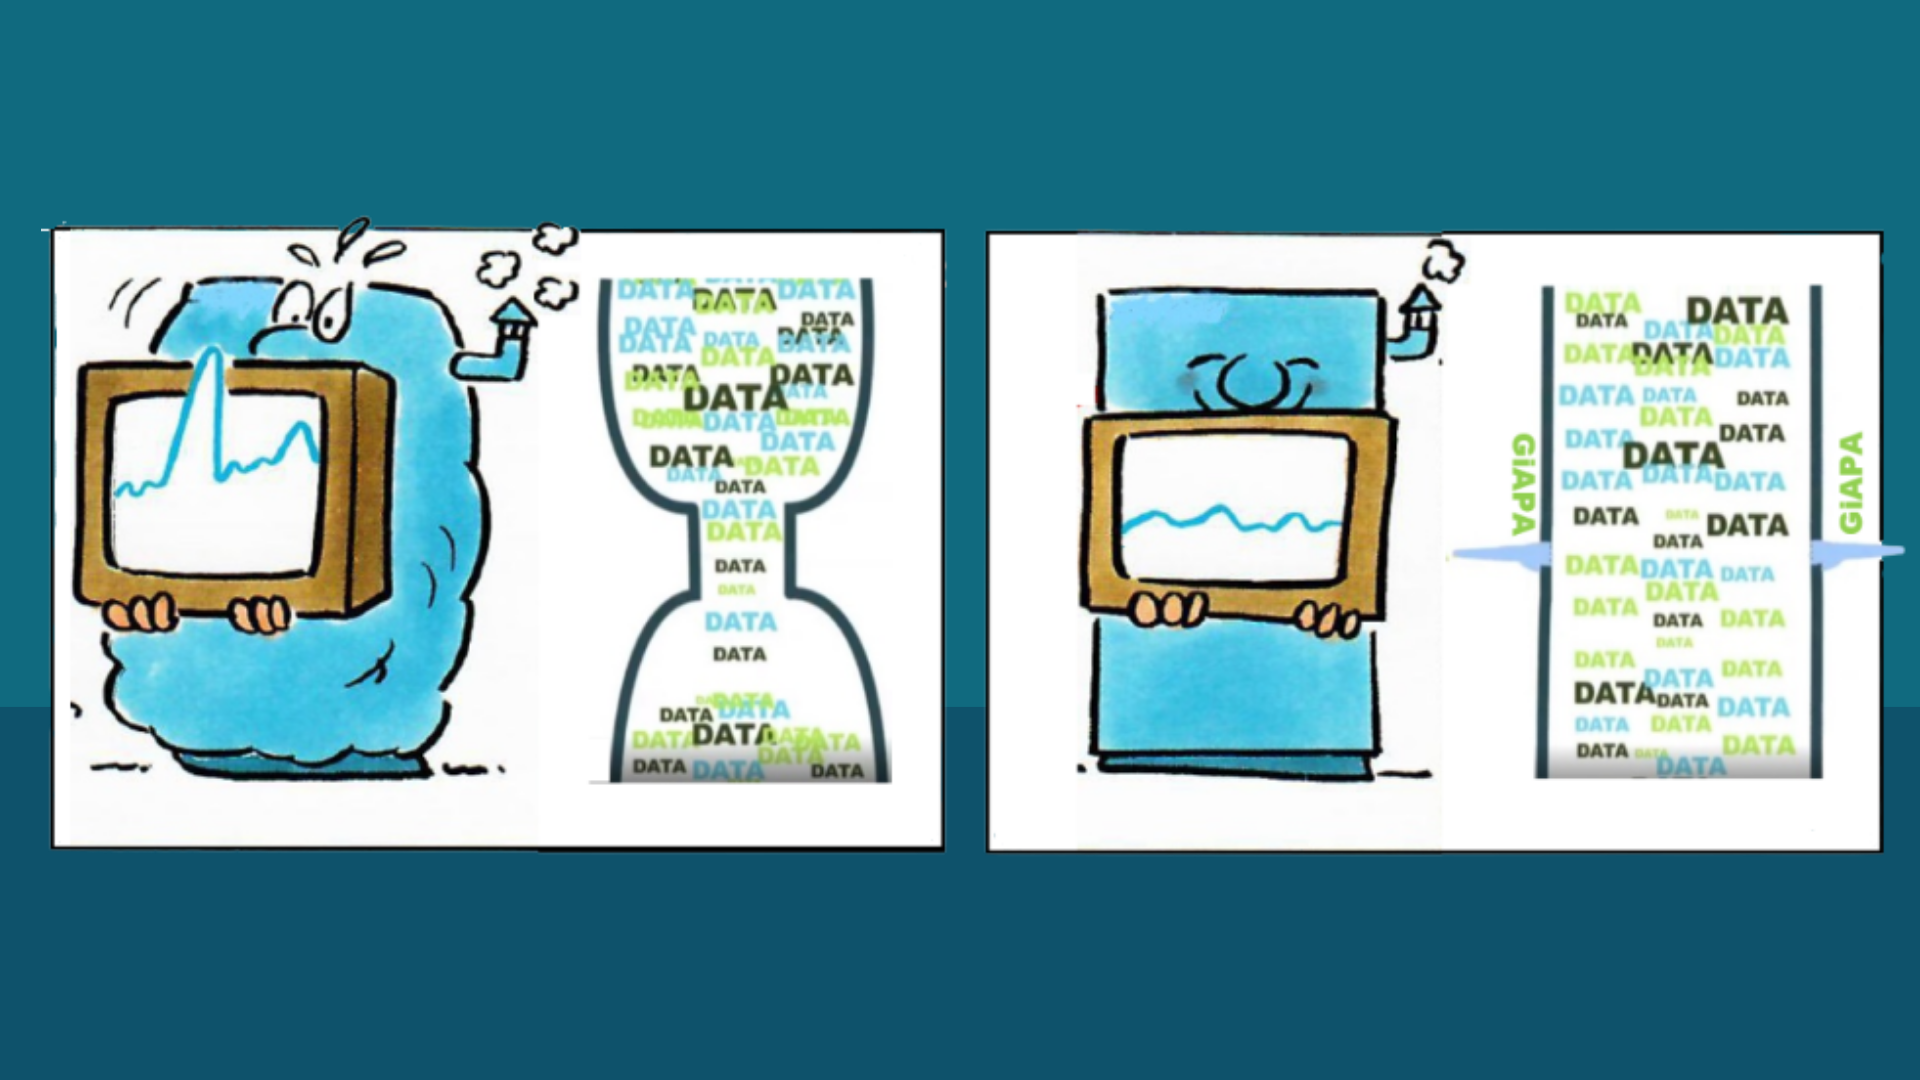
Every Power i system runs SQL statements in the background – thousands, sometimes hundreds of thousands, every single hour.
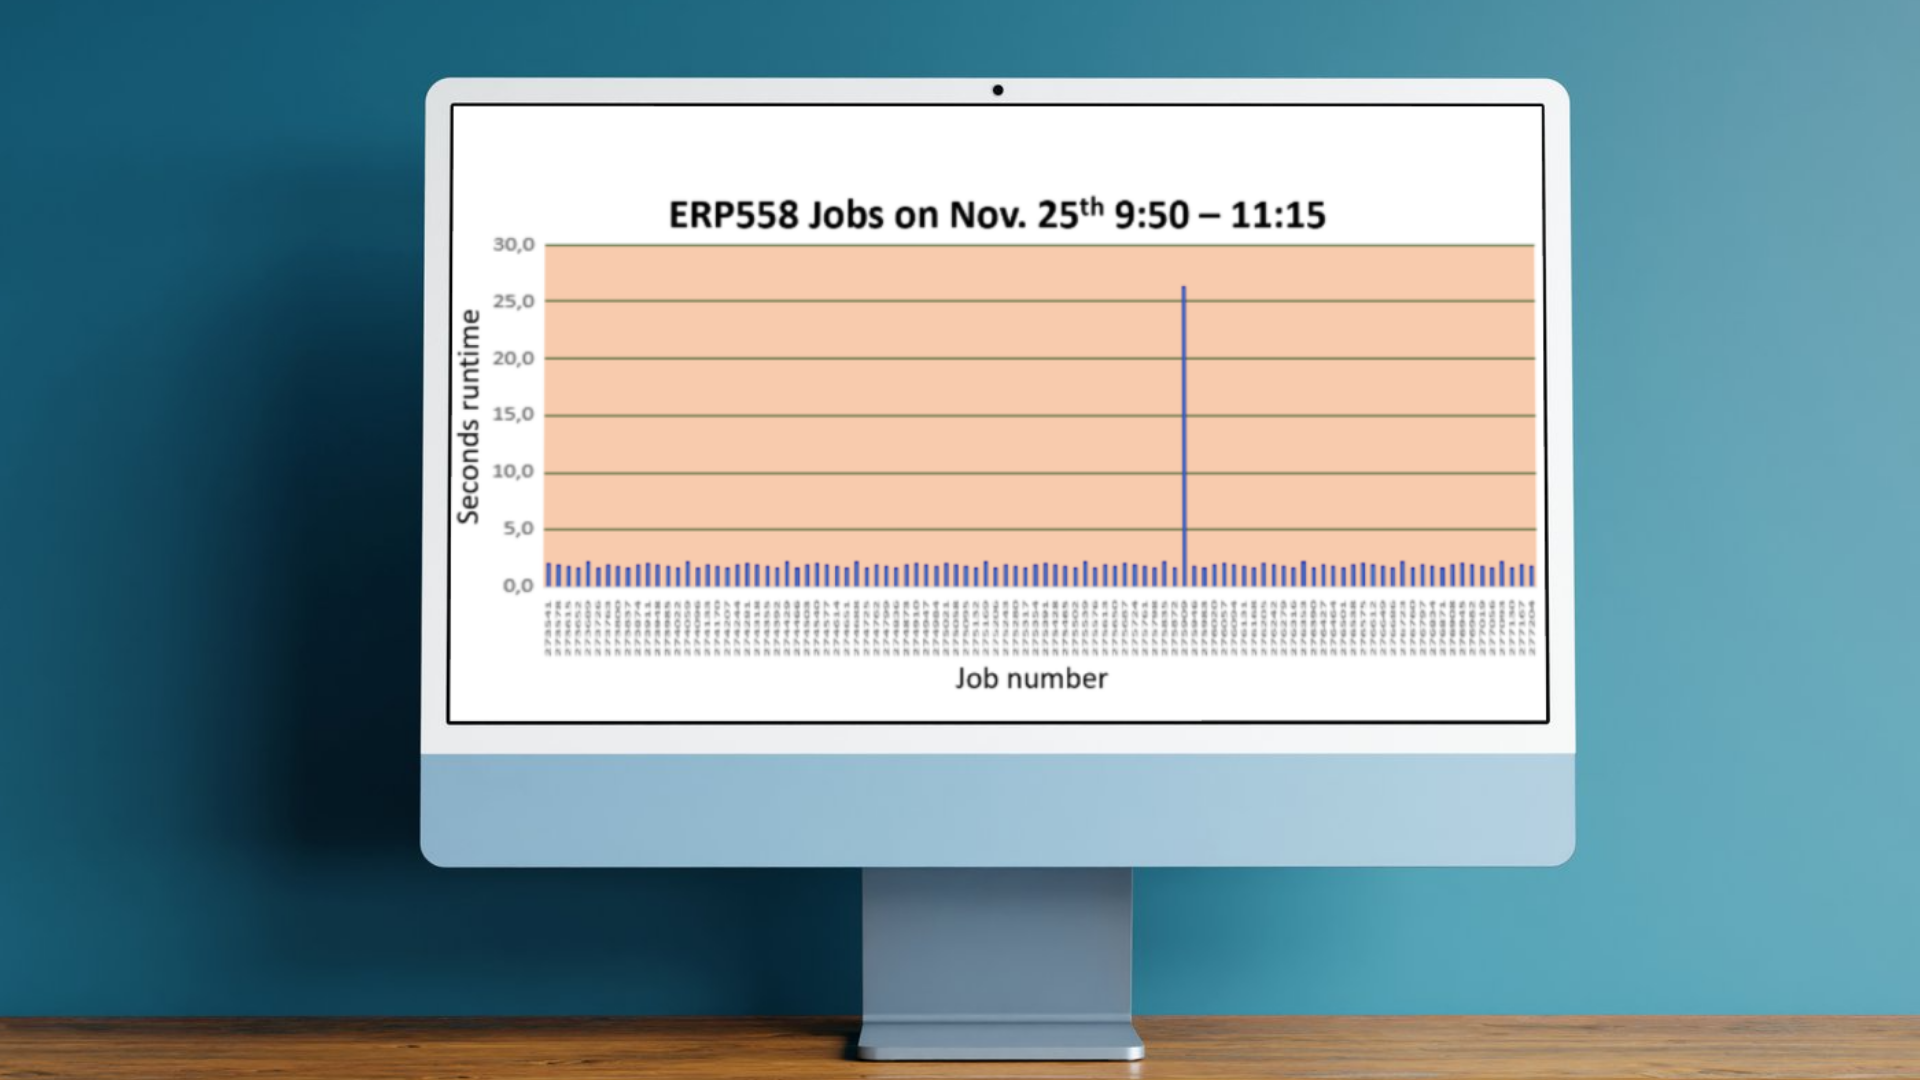
Although they may do what they’re supposed to do, the runtime may suddenly change dramatically, because a change in the run environment caused the Query Optimizer to change the access plan.
This can result in a significantly higher resource usage and increased run time – or oppositely, a significant improvement.
If the Plan Cache data for an access plan of the SQL statement has been dumped, SQL Performance Center within the IBM i Access Client Solutions offers analysis of why an access plan was chosen or changed. Knowing what caused the change, the run environment can normally be defined so that the optimum access plan is selected by the optimizer.
However, dumping all access plans all the time can be rather resource intensive.
GiAPA’s “SQL Observer” offers automated dumping of plan cache data for jobs and intervals selected by the user.
SQL Observer shows the SQL statements and their access plans (optionally selecting only access plans that were changed), and show the time and reasons for the change.
SQL Observer allows keeping an eye on the most resource intensive jobs without burdening the system too much.
Why this matters
I’ve seen SQL statements silently drain performance in otherwise well-behaved systems.
They’re not broken.
They’re just not efficient.
SQL Observer helps you find and fix them – before they become a problem.
In this section, you'll find in-depth articles, practical tips, and real-world experiences aimed at helping system administrators and IT decision-makers improve performance, reduce resource usage, and get more value from their IBM i environments. Whether you're exploring general best practices or diving into specific GiAPA capabilities, our insights are here to guide you. Explore, learn, and optimize.

.png)
In this section, you'll find in-depth articles, practical tips, and real-world experiences aimed at helping system administrators and IT decision-makers improve performance, reduce resource usage, and get more value from their IBM i environments. Whether you're exploring general best practices or diving into specific GiAPA capabilities, our insights are here to guide you. Explore, learn, and optimize.