June 14, 2025
Why FIFO isn’t Always FIFO: Lessons from User Queues on Power i
This is some text inside of a div block.


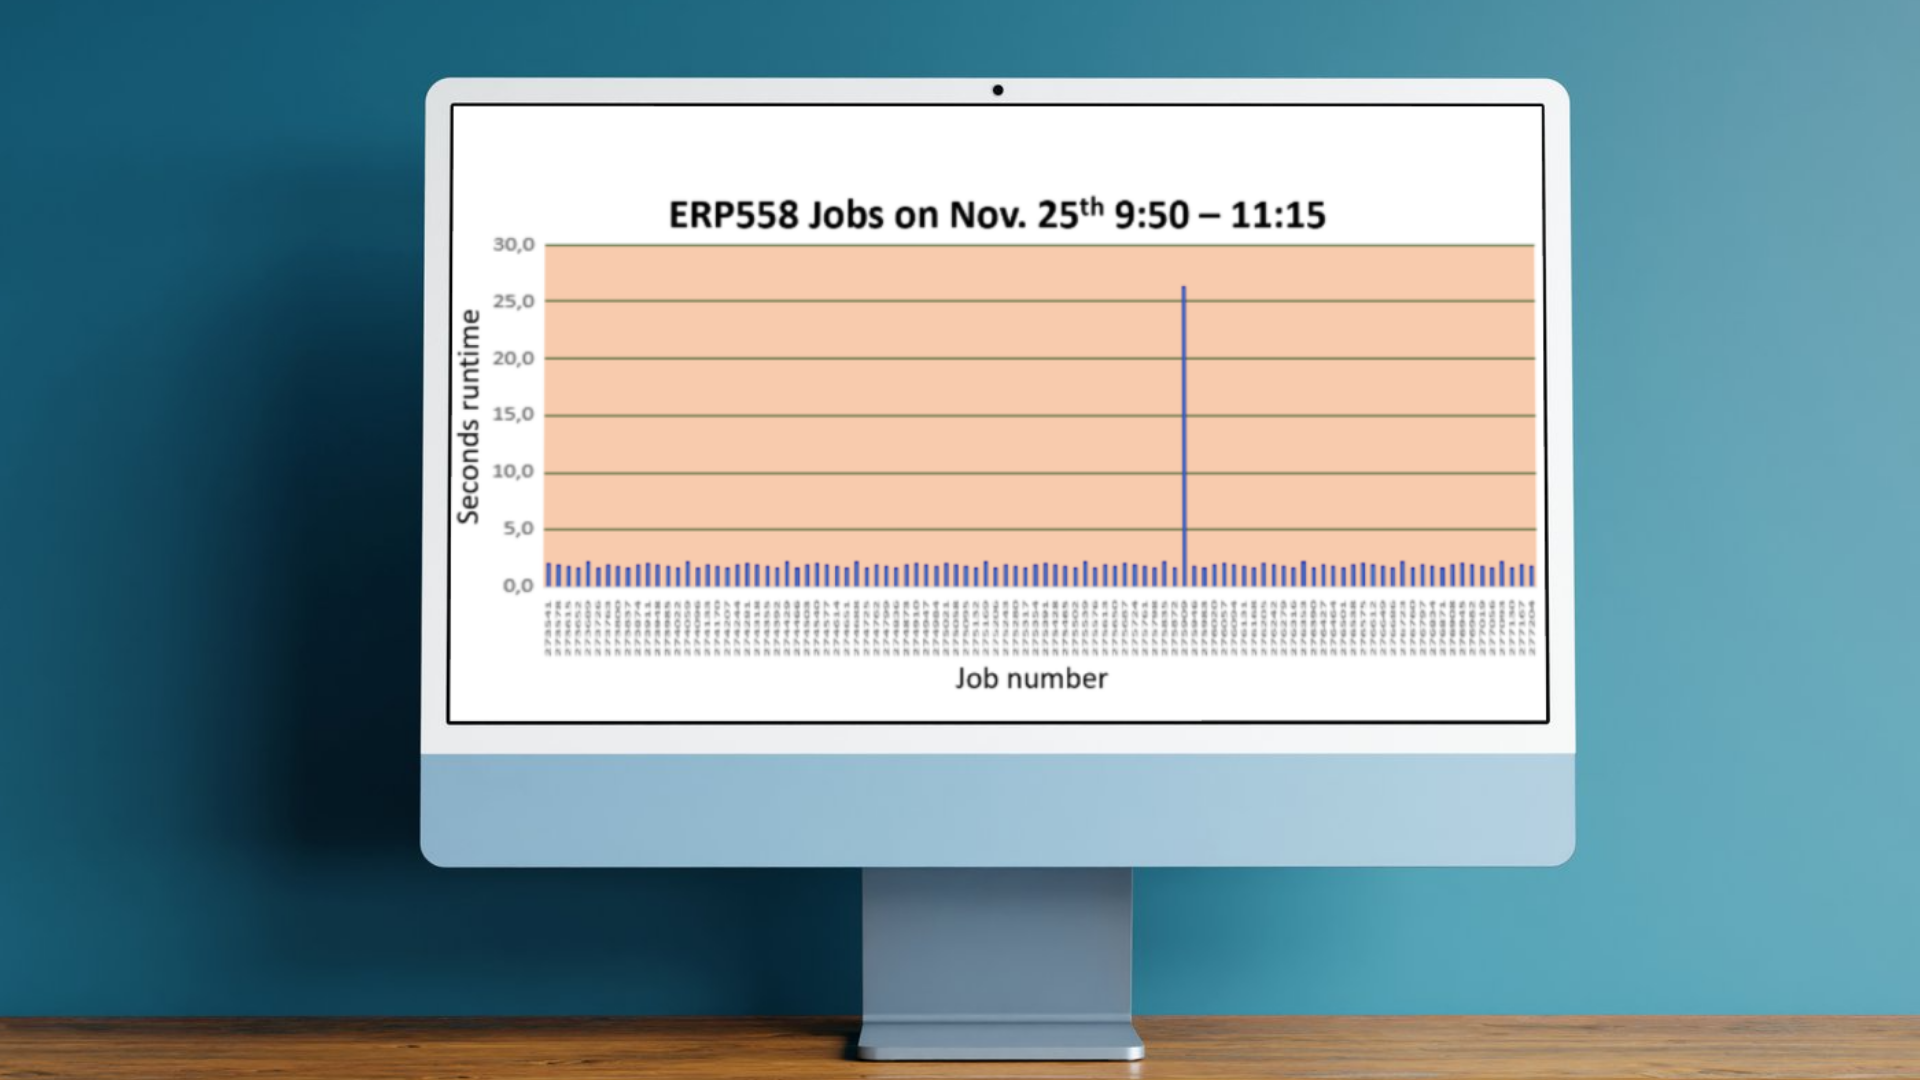
Not all performance problems are obvious.
Sometimes, a job that looks fine on the surface — average CPU, normal runtime — is hiding a deeper issue: inefficient file access.
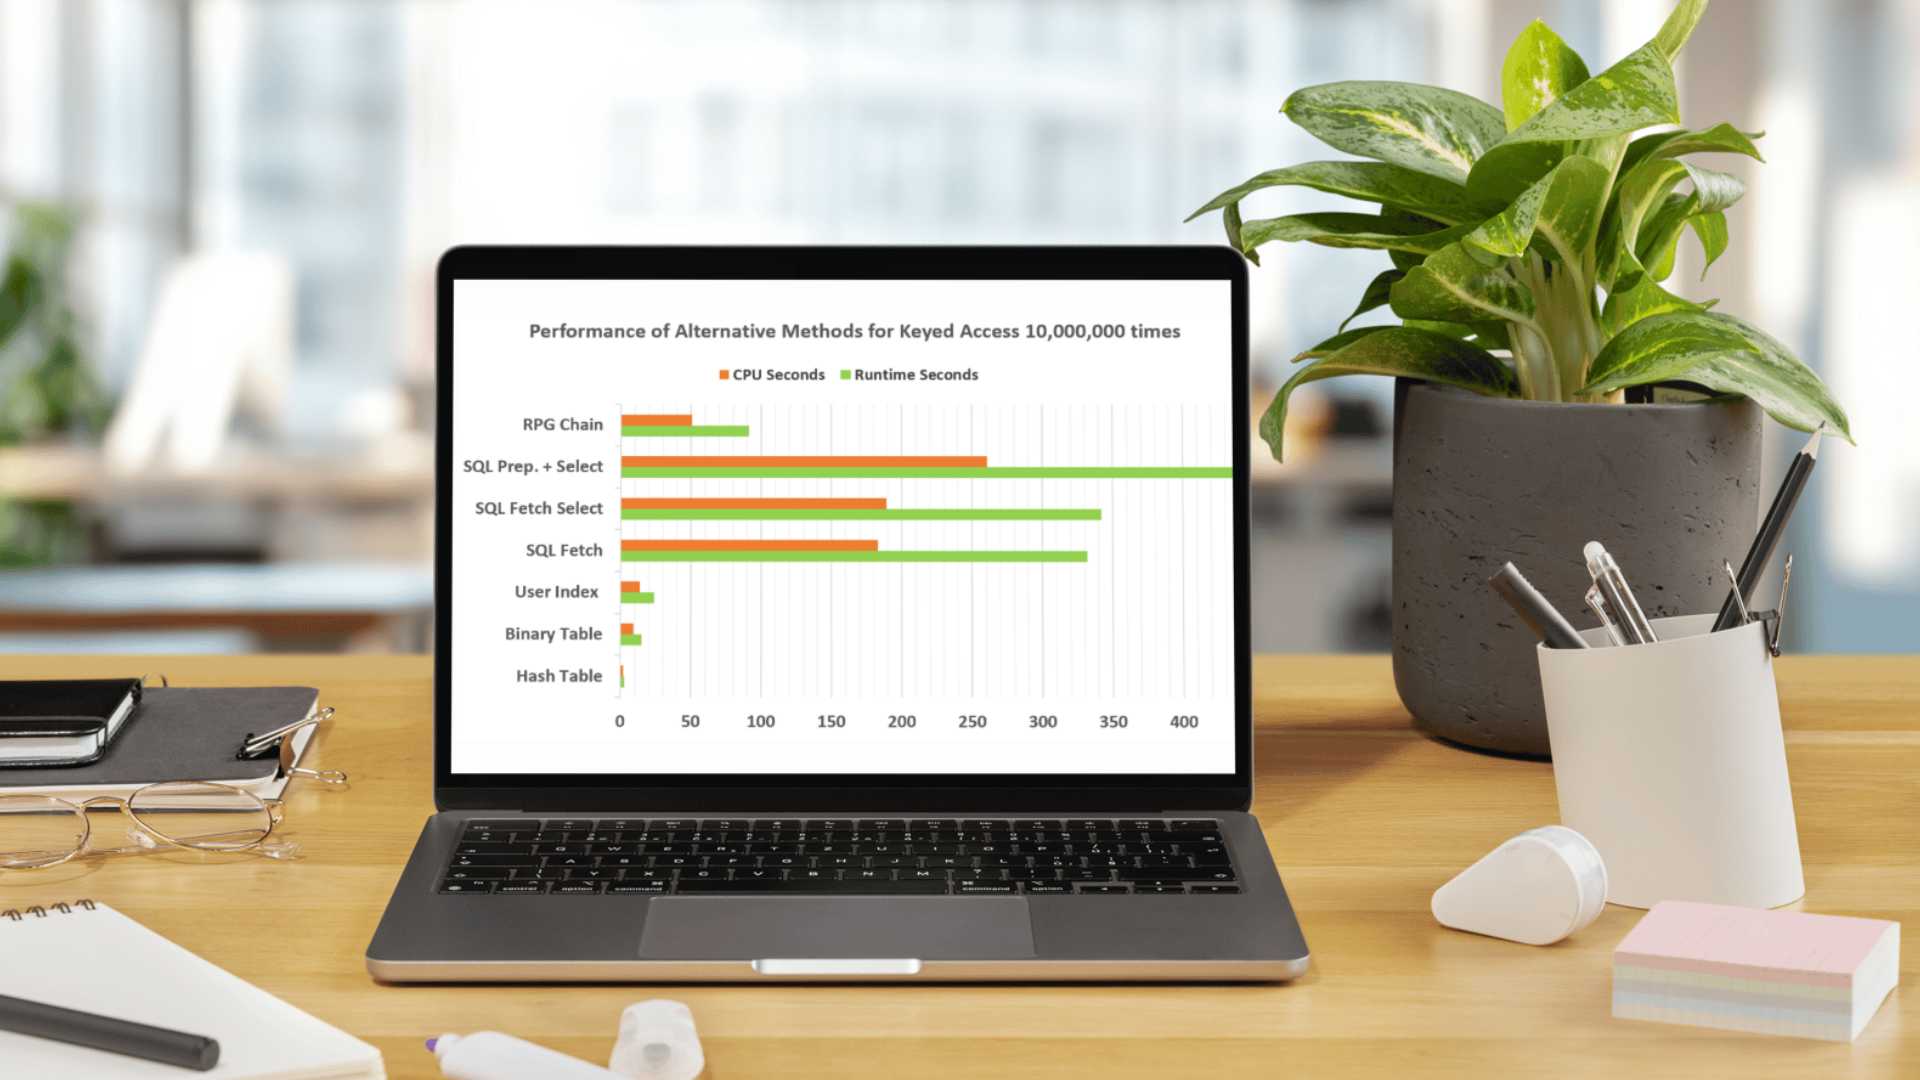
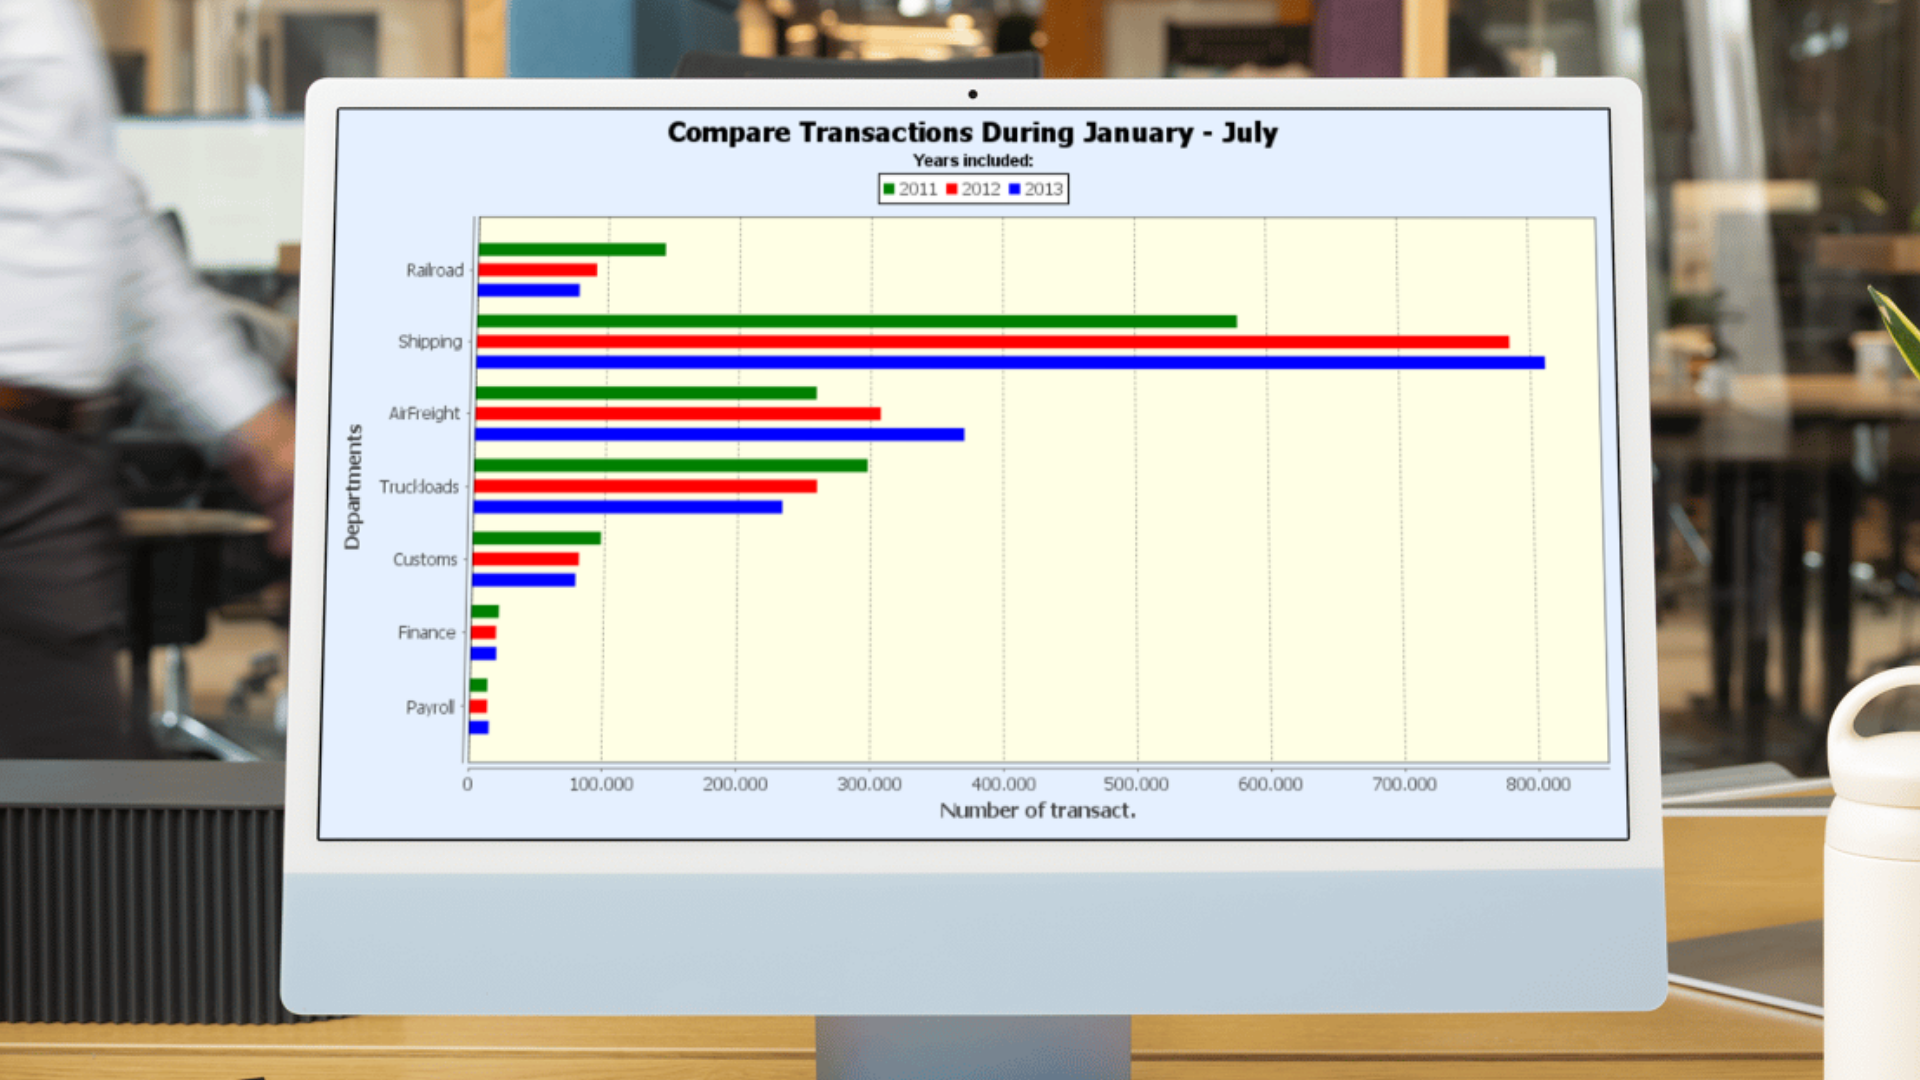
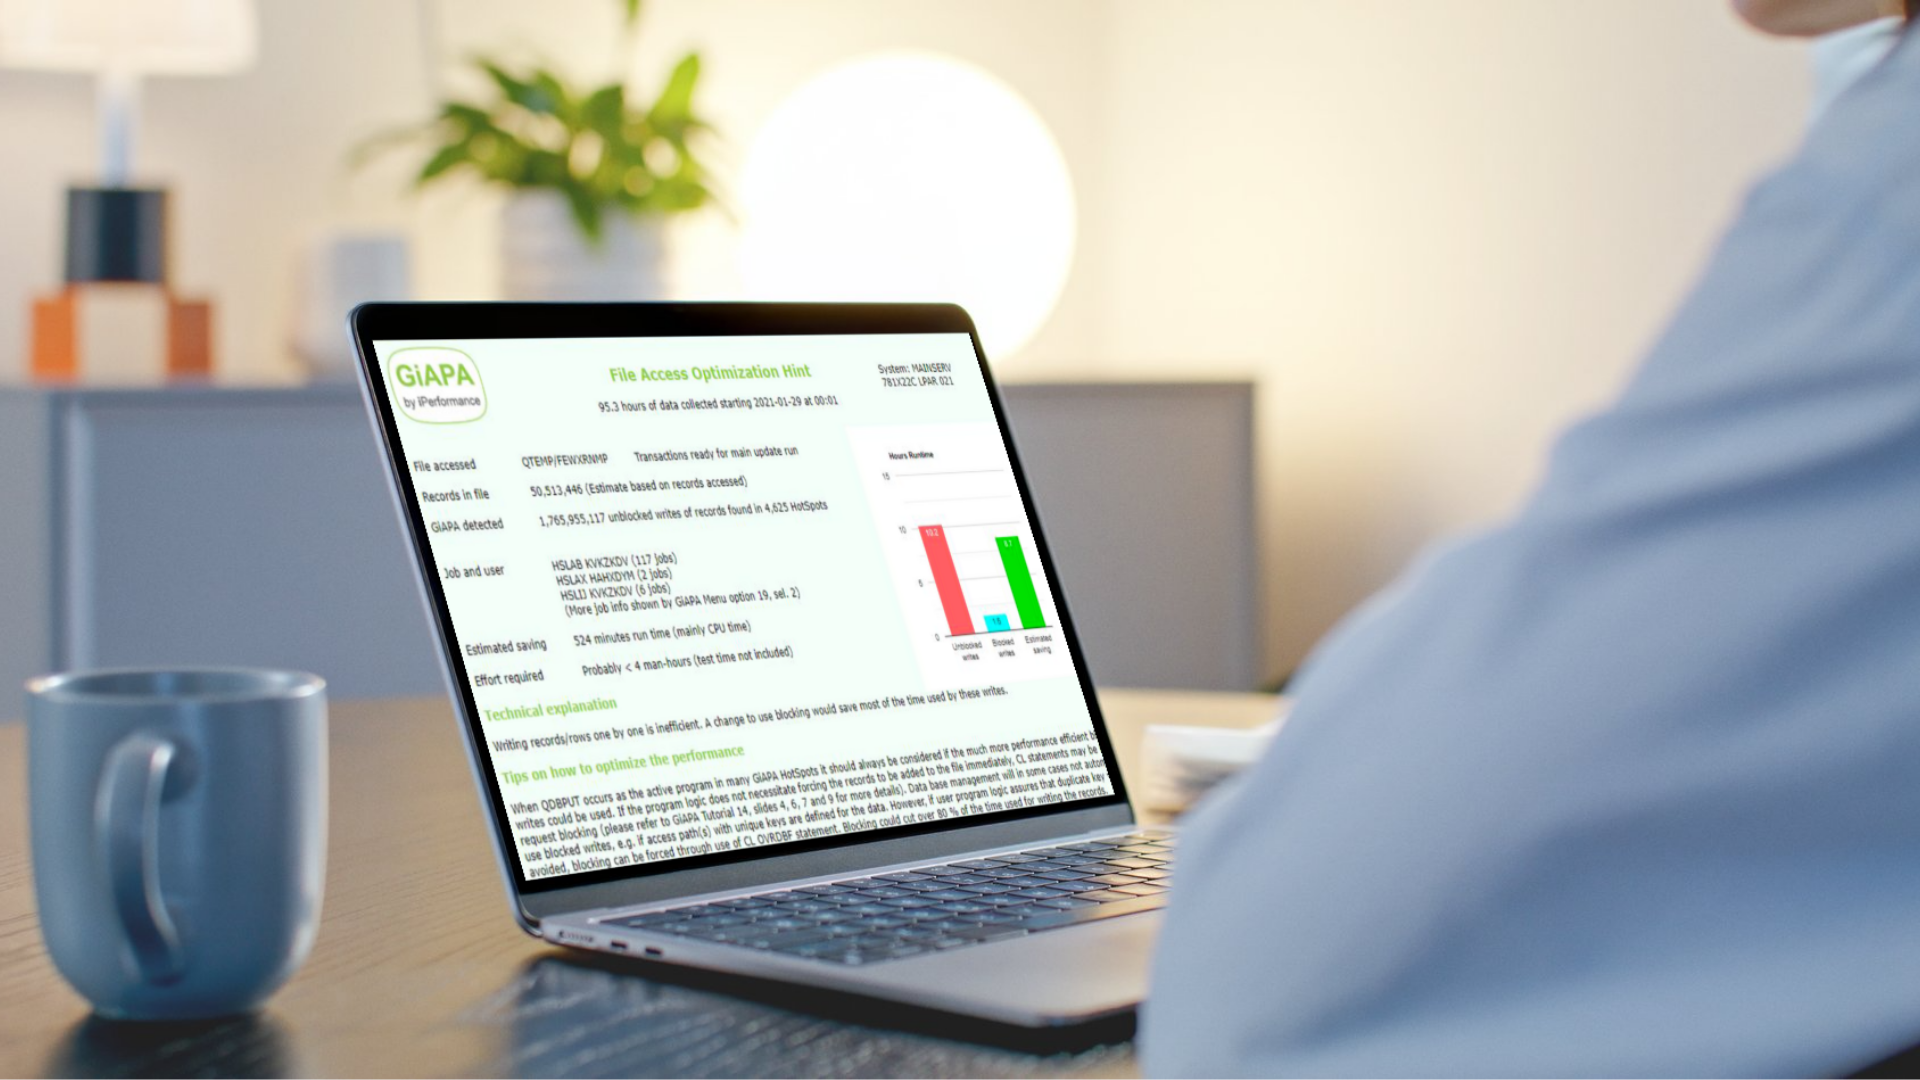
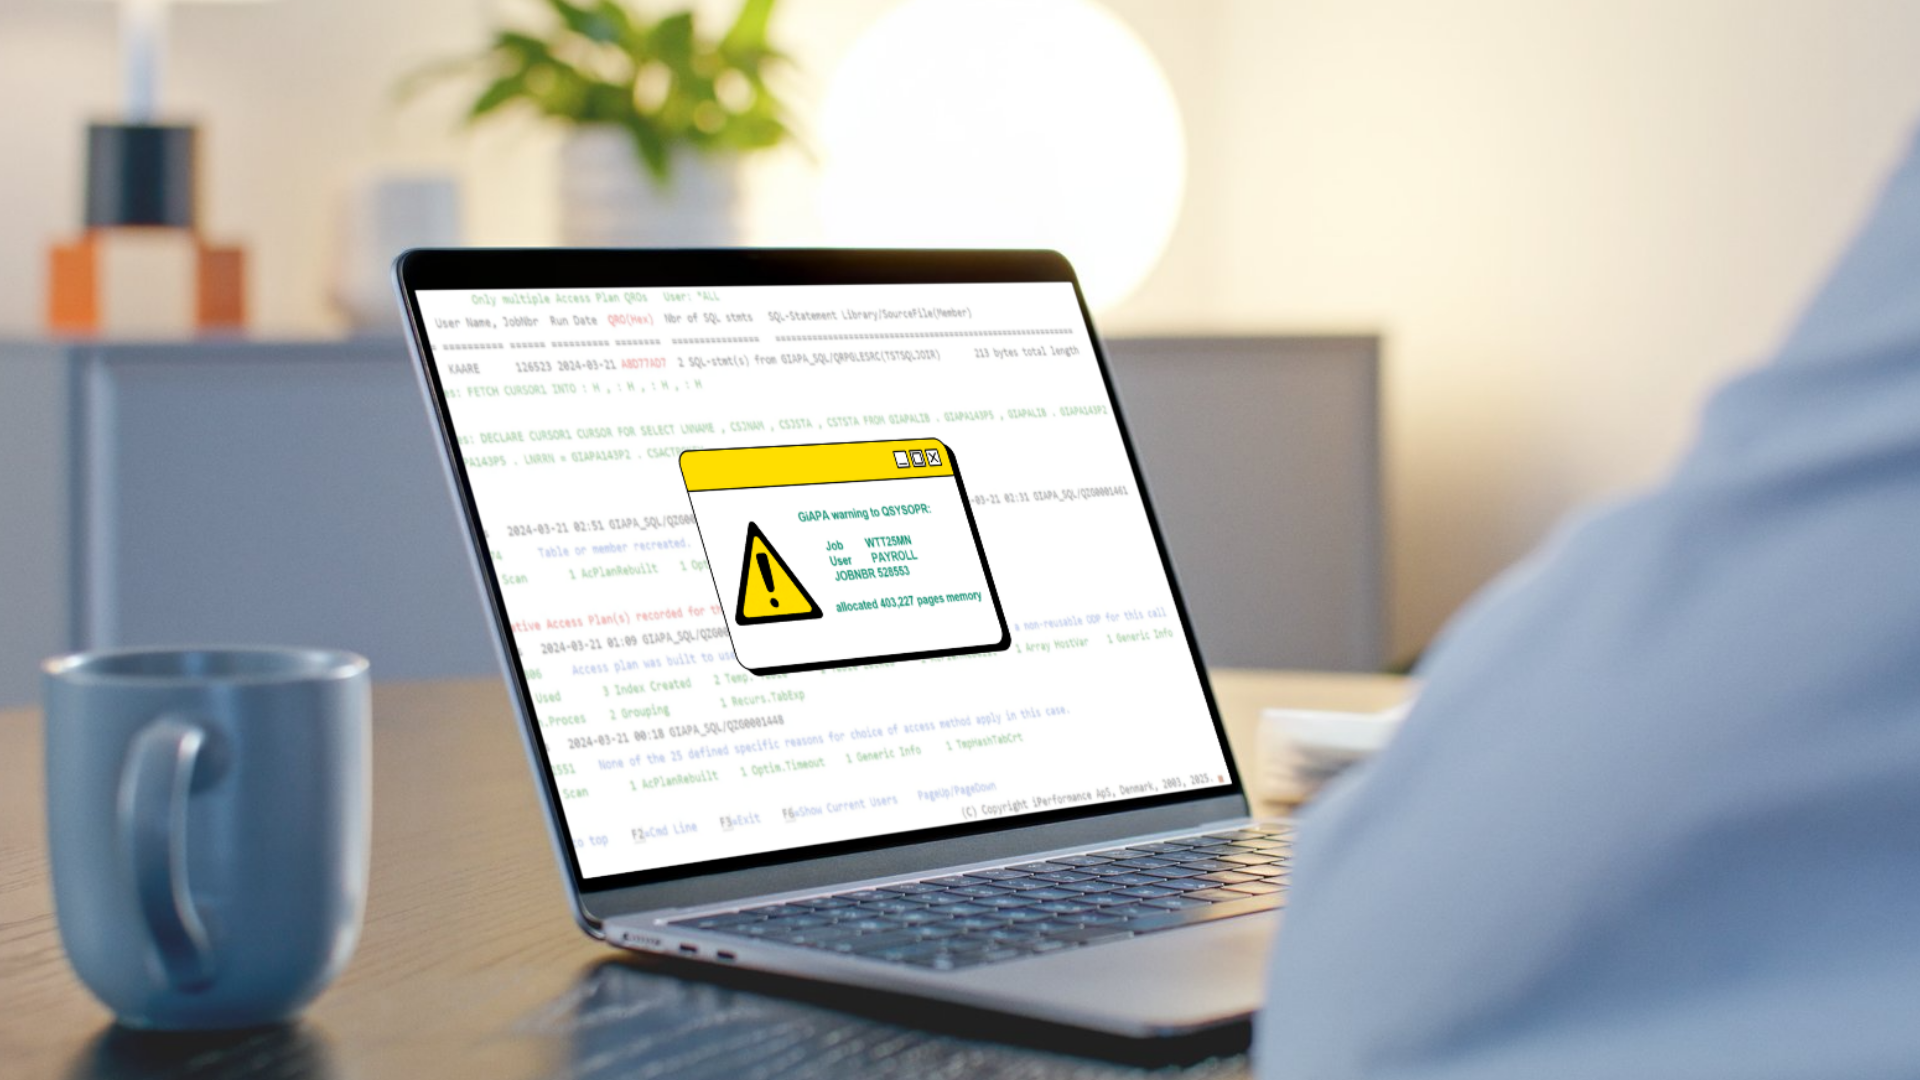
GiAPA’s File Access Analysis was built to find these hidden bottlenecks. By automatically recording how programs access files during execution, it reveals patterns that traditional metrics miss:
These aren’t problems you’ll spot in a CPU chart. But they can have massive impact on system performance — especially in batch jobs or high-volume workloads.
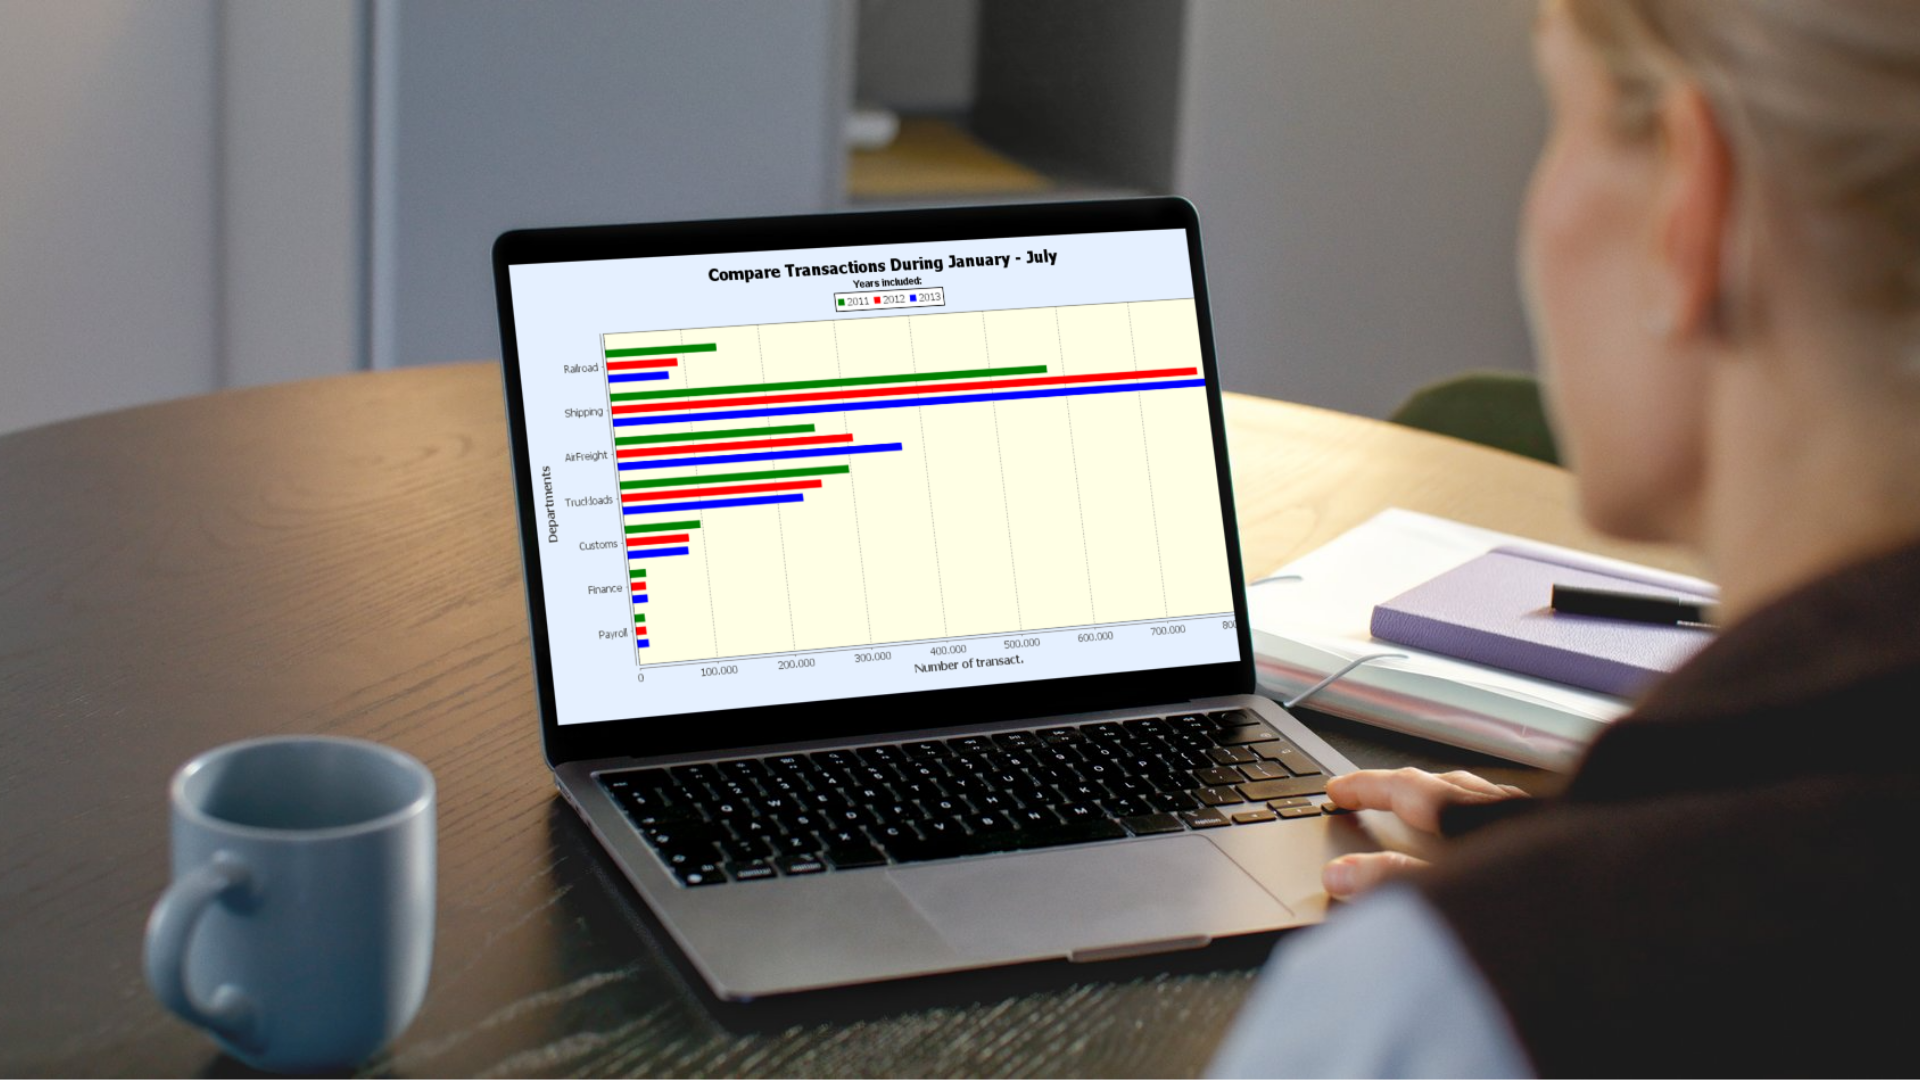
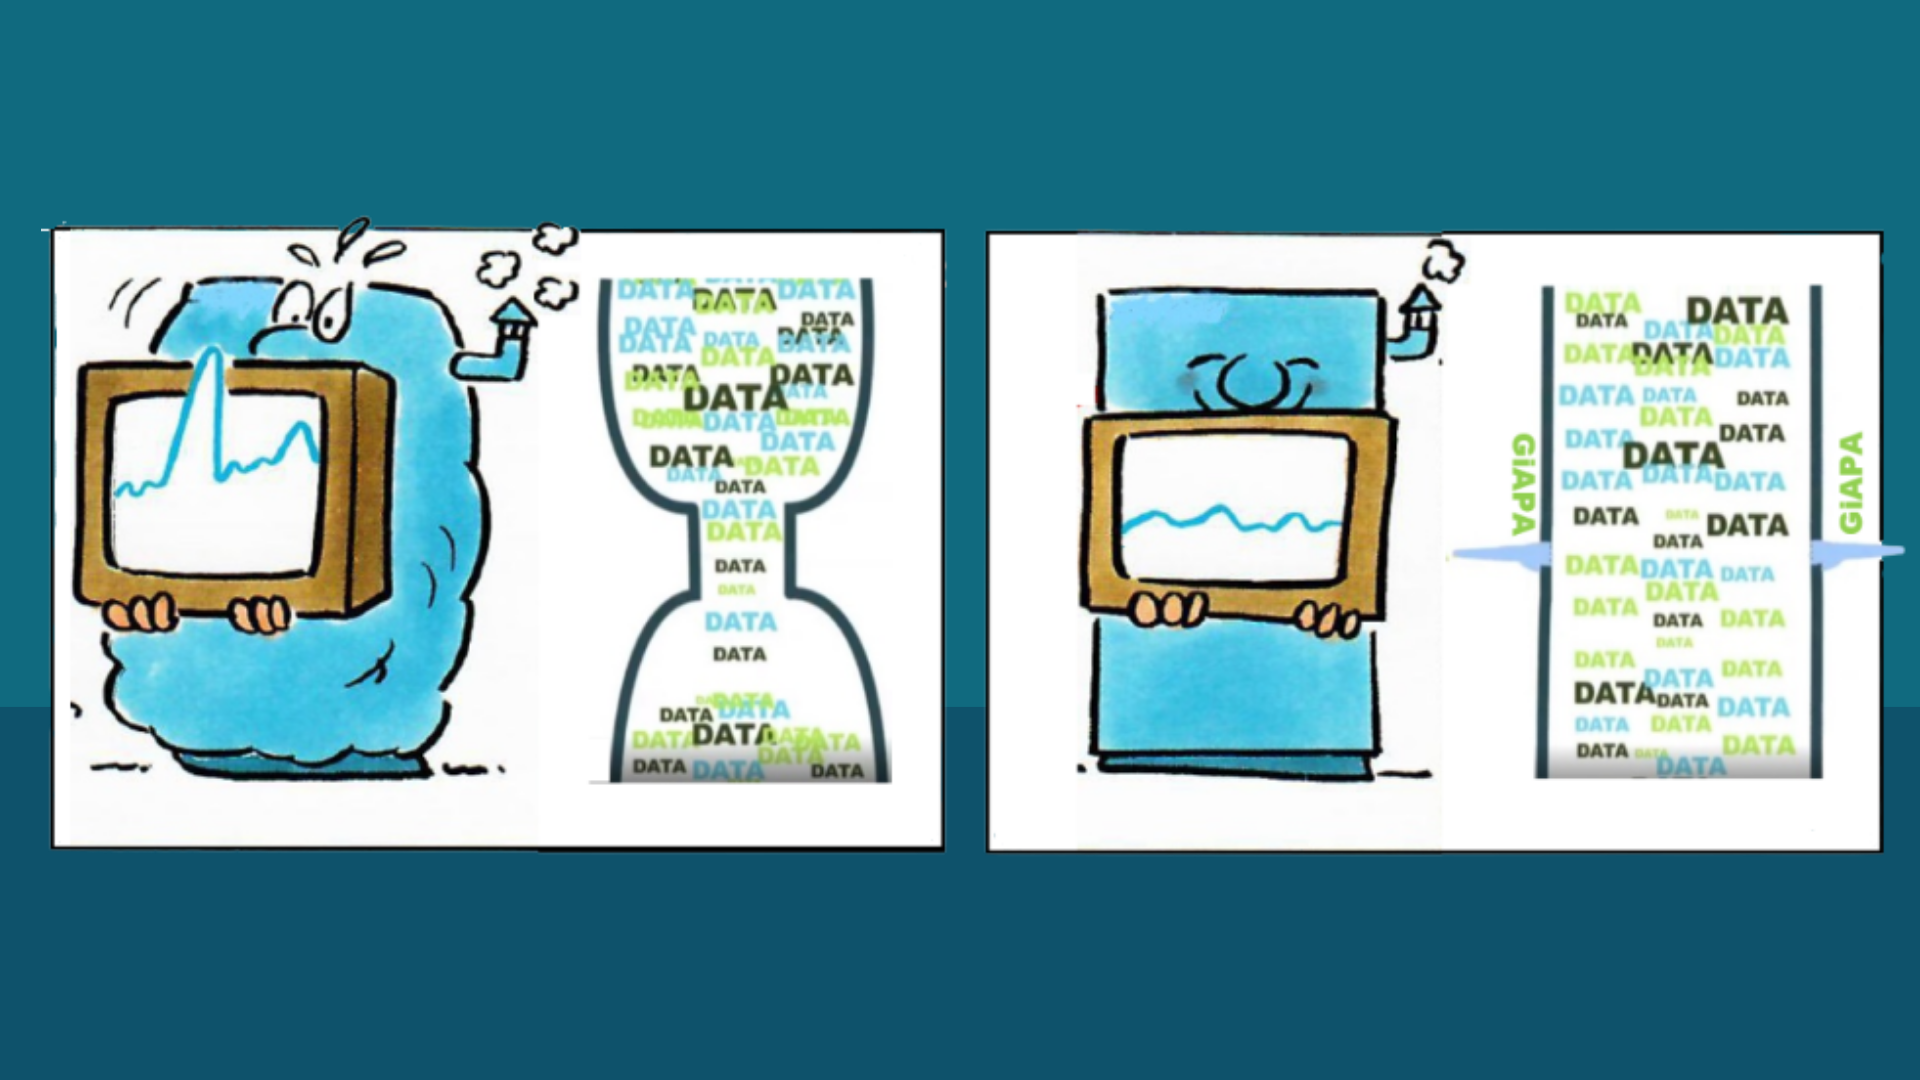
Developers using GiAPA often discover file usage issues in legacy code they thought was “good enough.” The more data volumes grow, the more important is the optimum choice of access methods applied.
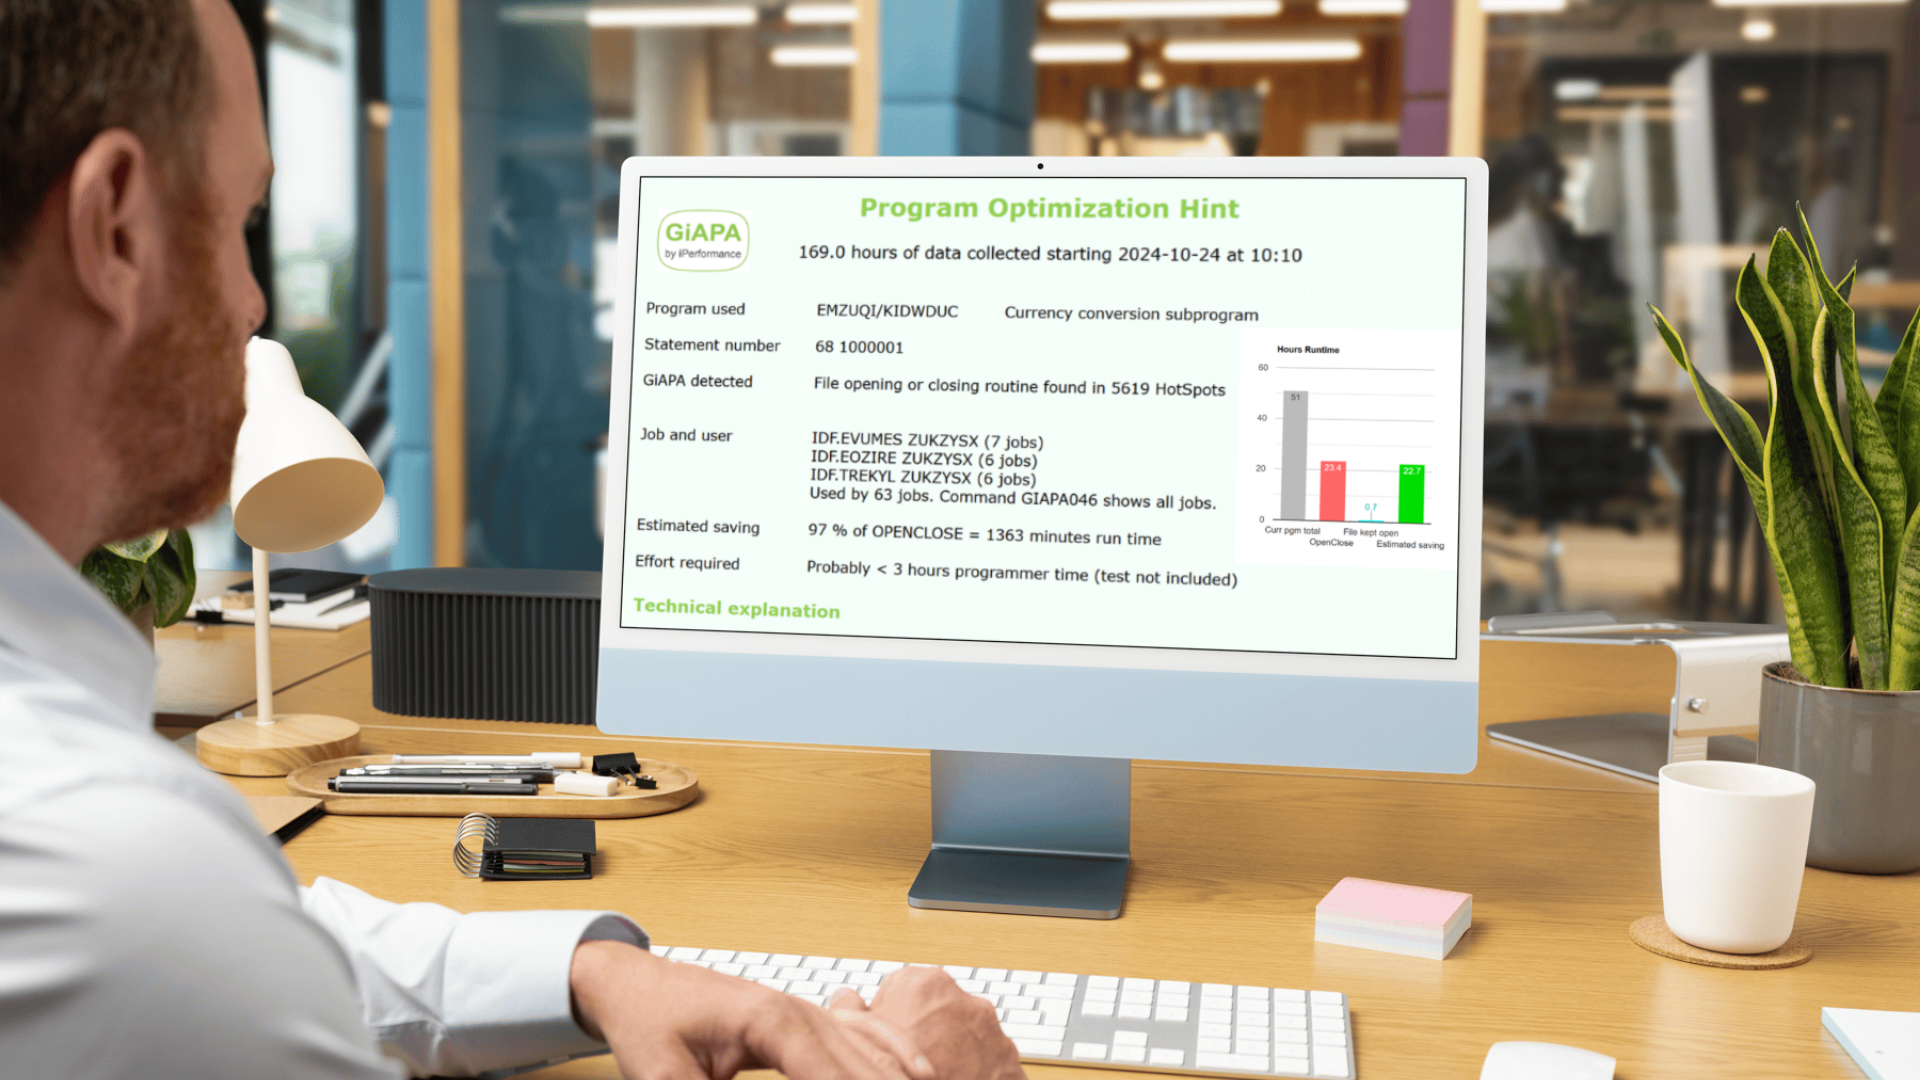
With GiAPA’s File Access Analysis, you can identify slowdowns before they affect users — and optimize where it actually matters.
Some bottlenecks don’t show up in traditional metrics. GiAPA’s File Access Analysis helps you find and fix inefficiencies in how programs interact with your data — before they turn into real problems.
In this section, you'll find in-depth articles, practical tips, and real-world experiences aimed at helping system administrators and IT decision-makers improve performance, reduce resource usage, and get more value from their IBM i environments. Whether you're exploring general best practices or diving into specific GiAPA capabilities, our insights are here to guide you. Explore, learn, and optimize.

.png)
In this section, you'll find in-depth articles, practical tips, and real-world experiences aimed at helping system administrators and IT decision-makers improve performance, reduce resource usage, and get more value from their IBM i environments. Whether you're exploring general best practices or diving into specific GiAPA capabilities, our insights are here to guide you. Explore, learn, and optimize.