
September 6, 2026
A Plan Snapshot Can Be Useful. But It Does Not Explain a Change by Itself
This is some text inside of a div block.
.svg)
SQL gives IBM i applications great flexibility, but it also changes how performance must be understood. With native I/O, the programmer selected the access method directly. With SQL, the developer describes the result that is wanted, while the SQL Optimizer chooses how to obtain it.
That choice can be different the next day, even when the SQL statement is unchanged. The relevant question if a job is slow is therefore whether a new access plan was used and, if so, when it changed and what in the runtime environment may have influenced the change.
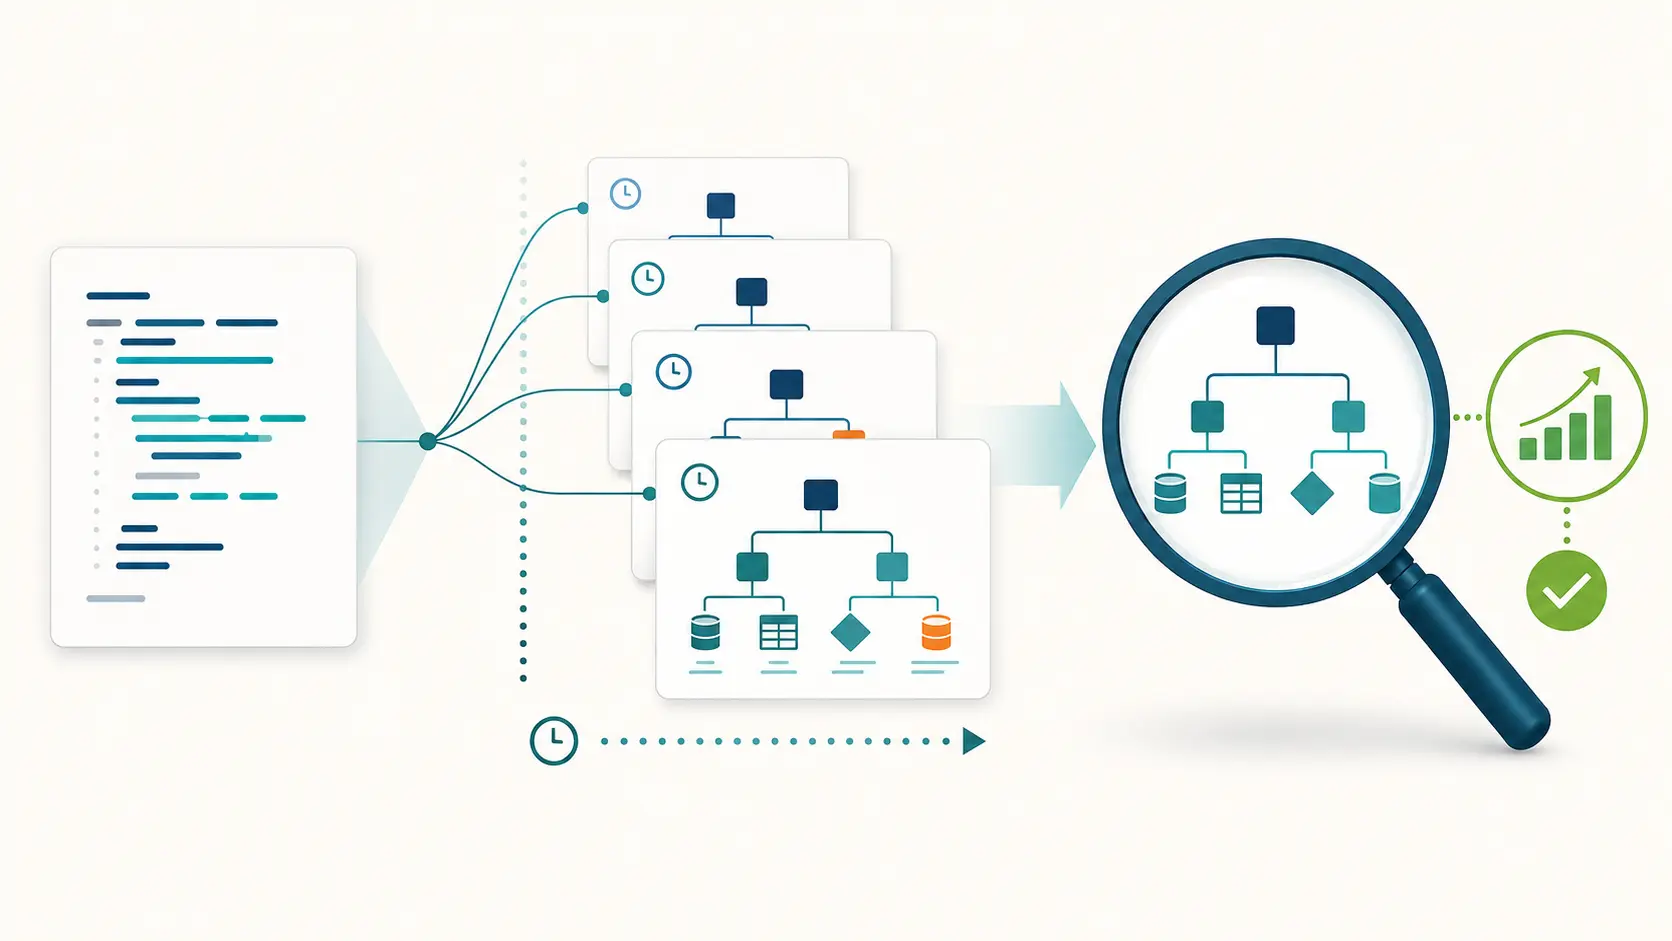
SQL performance often depends on the access plan chosen at runtime. Plan history helps show when that choice changes and gives the investigation a clearer starting point.
SQL and native I/O do not ask the system to work in the same way. With native I/O, the programmer selected the access method directly. In SQL, the developer specifies the result that is wanted, while the SQL Optimizer chooses the access method.
The Optimizer takes many conditions into account, including the expected number of resulting rows, the current environment and relevant query options. This gives SQL considerable flexibility, but it also means that a SQL statement cannot always be understood from source code alone. Two executions of the same statement may use different access plans when conditions have changed.
This is the strength in SQL. But it changes what evidence is needed when runtime suddenly increases or behaviour becomes difficult to explain.
What this changesFor SQL, it is often not enough to ask which statement ran. You also need to know which access plan the Optimizer selected at the time, and whether that plan later changed.An access plan shows how the SQL Optimizer chose to run a statement at a particular moment. That is valuable, but one plan is only one point in time.
It does not show whether the same statement used a different plan earlier, or whether the conditions surrounding the execution have changed. The SQL statement may be unchanged, while the plan, the data, the job environment, or relevant query options are not.
This matters especially when a job that has run acceptably for a long time suddenly takes much longer. Without a history of the plans used over time, it can be difficult to know where the change began.
A history provides data needed to tell if, when, and why a new access plan was generated.
IBM i stores access-plan information in the Plan Cache. That information can be very useful, but it is not presented as a simple explanation of what changed and why.
GiAPA SQL Observer retrieves Plan Cache data for user-selected jobs and intervals, and records it over time. It then expands the compact technical records into a report that can show which access plans were used, when they changed, and which IBM-supplied reason codes were recorded.
This is important because a plan change can have many explanations. A table may have been recreated, row counts may have changed, an index may have been added or become unavailable, or conditions may have changed, causing the Optimizer to select a different Open Data Path.
The purpose of GiAPA’s SQL Observer is not to replace IBM’s SQL analysis tools. It is to make the historical evidence easier to find and use, so that the right plan can be examined when a performance change needs a deeper explanation.
What the report makes visibleGiAPA SQL Observer does not decide whether a changed access plan is good or bad. It preserves the history and the IBM-supplied reasons, so that a technical investigation can begin with evidence rather than guesswork.When GiAPA SQL Observer shows that an access plan has changed, the next question is not simply whether the new plan is better or worse. The first question is what the recorded change tells us about the conditions surrounding the statement.
IBM provides reason codes that can explain why a plan was regenerated or why a different access method was selected. These may point to changes such as a recreated table or member, a significant change in the number of rows, a new or unavailable index, altered query options, or a change in the Open Data Path selected for the call.
Such reasons do not replace an investigation. They provide the context needed to ask better questions. If the plan changed after a table was recreated, for example, that is a different starting point from a plan that changed because an index became unavailable.
This is where historical plan data becomes particularly useful: it ties a possible explanation to a specific time and plan, rather than leaving the team with a generic statement that “SQL got slower.”
IBM’s SQL Performance Center in Access Client Solutions is a powerful tool for analysing individual SQL statements and access plans in depth. It is the natural place to go when a specific plan needs detailed technical examination.
GiAPA SQL Observer has a different role. It retrieves Plan Cache data for user-selected jobs and intervals, records it over time, and helps identify which plans changed, when the changes occurred, and which IBM-supplied reasons were associated with them.
In other words, SQL Observer preserves the history, thereby ensuring that data is available for analysis by IBM’s SQL Performance Center, if necessary.
The two approaches are complementary. One helps make change visible across time; the other provides the detailed analysis needed when that change should be understood more fully.
Two tools, different questionsGiAPA SQL Observer provides the historical input and helps answer: “Has the access plan changed, and if so, when?” IBM SQL Performance Center helps answer: “Which conditions caused this plan to be developed?”Historical SQL data is valuable only if it can be collected and retained without becoming a burden in its own right. That is why the scope of collection matters.
GiAPA SQL Observer allows the user to select which jobs should be observed and how often the relevant Plan Cache data should be retrieved. This makes it possible to focus on the jobs where SQL activity, data volume, or performance importance justifies closer attention.
Collecting every possible plan for every job at a high frequency would create unnecessary CPU usage, I/O, and storage needs. A more selective approach makes continuous observation practical while still preserving the evidence needed when an important performance change occurs.
The aim is not to collect data for its own sake. The aim is to make the right SQL history available when a question needs to be answered.
These articles explore the same topic from different angles: what data is missing when performance problems occur, which evidence matters most, and how small technical choices can create large runtime costs on IBM i.
.svg)
.png)
.webp)
.webp)