August 24, 2026
Why the Right Data Matters More Than More Expertise
This is some text inside of a div block.
.svg)
Application performance analysis on IBM i has long had a reputation for being difficult, expensive, and dependent on rare expertise.
That reputation is understandable. Performance problems are often hard to catch at the right moment. Jobs may run only occasionally, and delays may happen so rarely that, by the time someone notices something is wrong, the job has already ended and the evidence is gone.
That is why many IBM i shops still see performance work as something for specialists. But in my experience, the analysis itself is often not the hardest part. The hardest part is that the right data is usually not available when the problem occurs.
Once that obstacle is removed, many performance problems become far easier to understand than their reputation suggests.
There are at least two good reasons application performance analysis is often seen as complicated.
The first is that many IT departments do not have people trained specifically in program performance analysis. The second is that programming education has often focused much more on functional correctness than on performance. The underlying assumption has often been that servers are now so fast that performance rarely matters.
That assumption may sound reasonable, but it falls apart in real production environments. Applications do not consist of one function executed once. They consist of many small functions, some of them executed hundreds of thousands or millions of times. In such cases, small inefficiencies can easily add up to large delays.
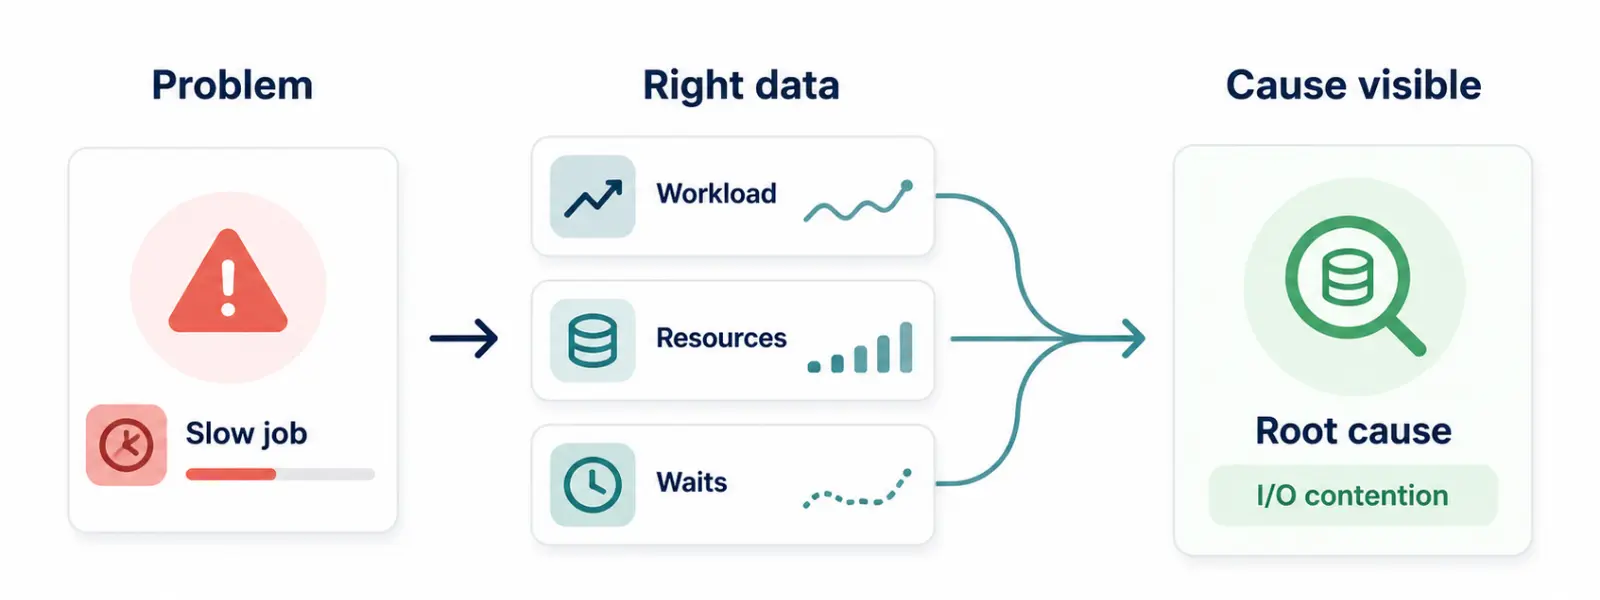
But even when people suspect a performance problem, they still face another difficulty: they often do not know which data to collect, and the required data depends on the nature of the problem. That creates a familiar circle: you need data to understand the problem, but you need some idea of the problem before you know which data to collect.
This is where many investigations stall.
What this showsIn many cases, the real difficulty is not the analysis itself. The real difficulty is that the right data is missing when the slowdown happens. Once the necessary data is available, the explanation is often much easier to find than people expect.IBM offers powerful tools and APIs that can provide very detailed insight into what jobs are doing. The problem is not that the data cannot be obtained.
The problem is that sufficiently detailed data is rarely collected continuously across all jobs, because many people assume that doing so would be too expensive or too impractical. As a result, when a problem appears, the first step becomes collecting data, and that is often the slowest part of the whole investigation.
If the issue is intermittent, the difficulty becomes even greater. A transaction that normally completes in one second may occasionally take 30 seconds. A small job that usually finishes immediately may sometimes be delayed just long enough to frustrate users, but not long enough for operations staff to investigate it while it is still active.
Without the right documentation of what the jobs were actually doing at that moment, even a highly skilled specialist may spend a great deal of time guessing.
Recommended practiceStart with broad, lightweight collection across all jobs, then add deeper data only where the CPU pattern or delay justifies it. That gives you a practical balance between visibility, precision, and low overhead..webp)
One example involved a key application where a transaction that normally completed in about one second could occasionally take as long as 30 seconds. The issue was serious enough to frustrate users, but not frequent enough to be easy to catch in real time.
An experienced IBM performance specialist had already looked at the case, but the available data did not reveal the root cause. The delay did not appear to come from CPU pressure. CPU utilization was well below 100%.
When performance data including allocation and deallocation of memory became available, the cause of the problem was quickly identified.
The SMPO* jobs (Storage Management Page-Out activity) showed a spike at the exact time of the slowdown. Looking for jobs having allocated many pages at that point in time gave the actual cause: an SQL job creating a large temporary table had, because of its priority, effectively taken memory away from other jobs. The important point is not just that the problem was solved. The important point is that it could easily be understood because the necessary data was available.
Another case involved a monthly batch job at a large insurance company. Its total runtime exceeded 83 hours.
IBM had already analyzed the case and concluded that, given the extremely high number of read operations, the system was performing quite well. But once open file information including samples of relative record numbers accessed was available, the true cause became visible very quickly.
All records in a small QTEMP file were being read repeatedly by key inside a main processing loop. That was not a hardware problem. It was an application design problem.
By moving the read operation outside the inner loop, the runtime was reduced from 83 hours to 25 hours.
In another case, a nightly batch job ran unexpectedly for several hours. Because detailed call stack data had been collected for CPU-intensive jobs, it was possible to see very quickly where the time went.
The result was surprisingly clear: about 95% of the runtime was spent on the QUSROBJD API, used to retrieve file size information.
The mistake was simple. The API call had been placed inside the file-processing loop and was therefore executed alongside each read operation, instead of being called once when the file was opened.
Moving that API call outside the loop reduced runtime by 94%. Again, the solution was not difficult once the right data had made the problem visible.
Why this mattersThese examples point to the same conclusion: in many cases - actually in most - the hard part is not finding the explanation once the right evidence exists. The hard part is making sure that the evidence is available when the problem occurs.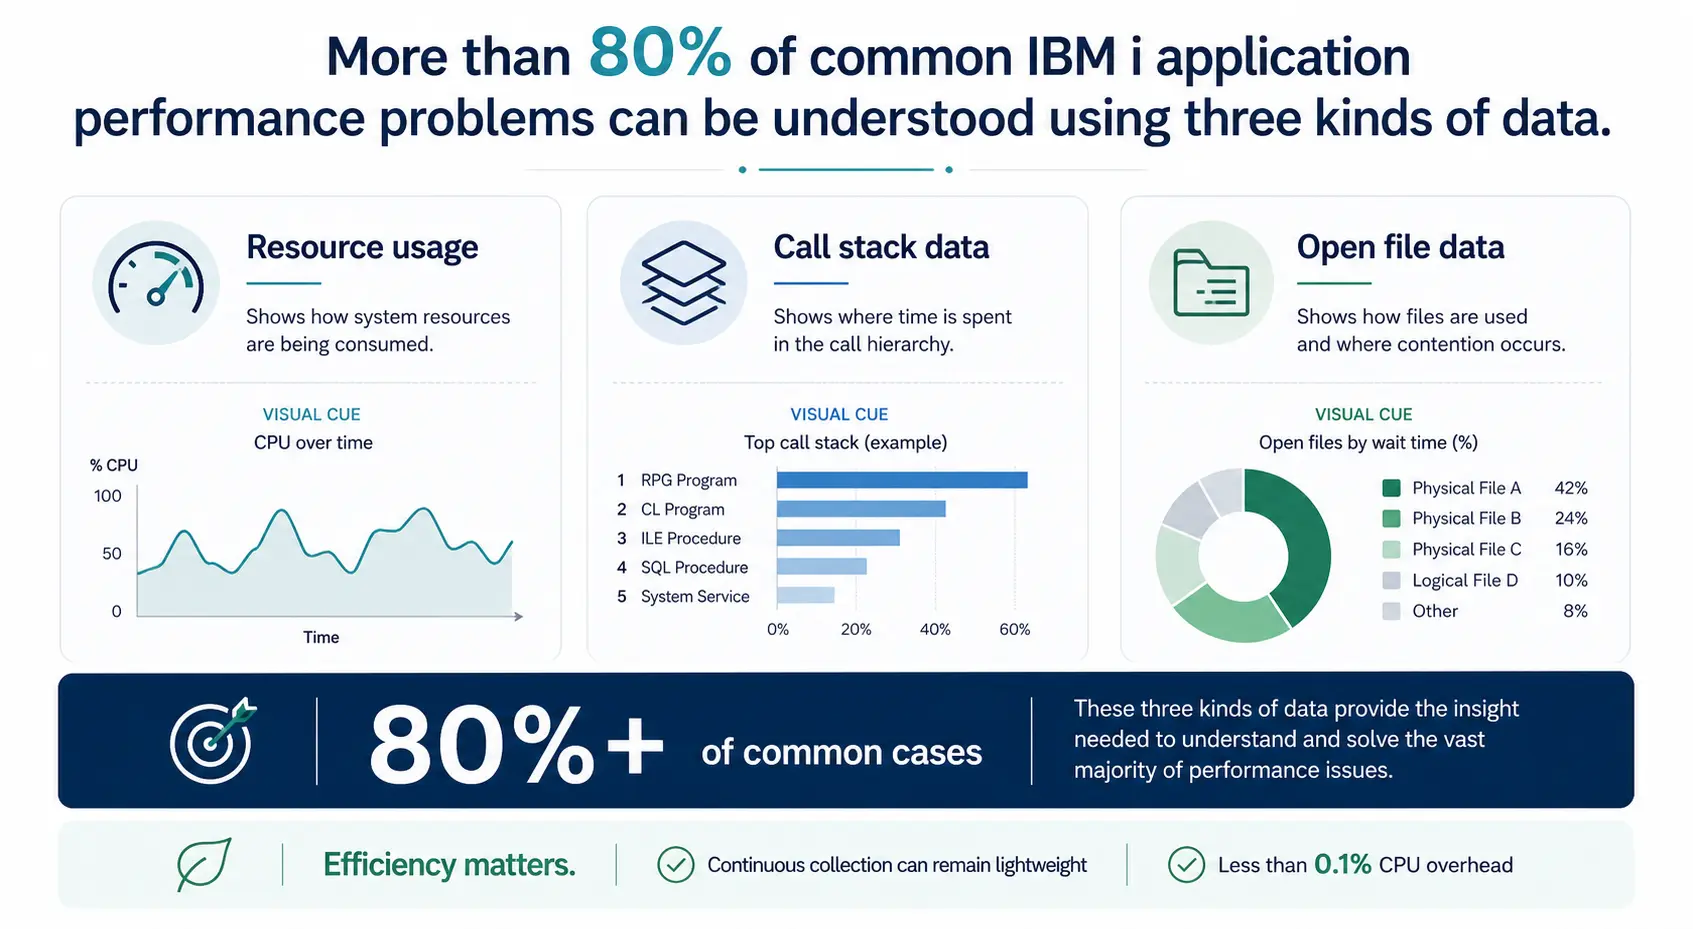
Based on many real cases, a fairly simple conclusion can be drawn: to solve the majority of application performance problems, you do not need every possible kind of diagnostic data.
What you usually need is:
According to the experience summarized in the GiAPA material, this is sufficient for more than 80% of common performance issues. The remaining cases are often SQL-related, which is why SQL needs its own dedicated analysis path.
If the right data is collected continuously, the whole nature of performance analysis changes. You no longer need to begin every investigation by asking what should be collected, and whether it can be collected while the problem is still happening. Instead, you can start with the real question: what was the job actually doing?
That shifts matters. It changes application performance analysis from a reactive, specialist-driven exercise into a much more practical discipline.
Of course, continuous collection only makes sense if the overhead is negligible. That is why efficiency matters so much in the collection mechanism itself. One of the key ideas behind GiAPA is precisely this: to collect relevant data continuously, and still keep the overhead to a minimum.
The data collection target for GiAPA is using less than 0.1% CPU. This is achieved by compressing the collected data strongly.
Collecting data is not enough by itself. The real value appears when the data helps answer practical questions such as:
This is where application performance work becomes much more useful to programmers, operations staff, and management alike.
The point is not simply to produce more reports. The point is to make it easier to move from observation to improvement.
IBM i application performance analysis has historically been seen as something difficult, slow, and dependent on rare expertise. There are good reasons why it earned that reputation.
But the cases above suggest that much of the difficulty comes not from the analysis itself, but from the absence of the right data when the problem occurs. When that obstacle is removed, many problems become straightforward to explain.
And, once the explanation is visible, improvement often becomes far simpler than people expect.
Proactive Performance Optimization
One important side-effect of GiAPA's automatic analysis is that it even includes jobs not suspected to have performance problems, thus changing the game from being "fire extinguishing".
This, in my view, is the real benefit with GiAPA: to not just diagnose performance problems faster, but to make application performance work more proactive, practical, more systematic, and less dependent on guesswork.
These articles explore the same topic from different angles: what data is missing when performance problems occur, which evidence matters most, and how small technical choices can create large runtime costs on IBM i.
.svg)
.png)