Optimize Performance of Your IBM i Applications

GiAPA analyzes all jobs automatically, pinpoints optimization potential, and shows the obtainable savings and the effort.
  • feature icon
    GiAPA often finds possible run time improvements even in old programs believed to run efficiently.
  • feature icon
    Free Performance Tips
GET A FREE TRIAL
Thank you! Your submission has been received!
Oops! Something went wrong while submitting the form.
hero bg shapehero main image
anylyticshero card image
hero small card imageshape
arrow
hero marequee image
Free Trial
hero marequee image
First Performance Tips Free
hero marequee image
Free Trial
hero marequee image
First Performance Tips Free
hero marequee image
Free Trial
hero marequee image
First Performance Tips Free
hero marequee image
Free Trial
hero marequee image
First Performance Tips Free
hero marequee image
Free Trial
hero marequee image
First Performance Tips Free

Free GiAPA Trial Includes
Automatic Performance Analysis of All Jobs

Step 01
step border
step icon

Download and install GiAPA

No configuration needed.
Get going in <15 minutes.
Step 02
step border
step icon

Collect data up to 48 hours

GiAPA's data collection for all jobs every 15 seconds uses less than 0,1% CPU.
Step 03
step border
step icon

Run analysis and see results

Let the automatic analysis pinpoint any potential performance improvements.

GiAPA in a Nutshell

In addition to resource usage data for all jobs, GiAPA also collects data showing
what the jobs are doing.

lead check icon

This additional data includes
how each file is accessed, and
which program function is active

lead check icon

Statistics on these examples of job activity enables GiAPA to run automatic analysis pinpointing performance inefficiencies.

lead check icon
Start Free Trial
lead imagelead shapeLead CardLead Feature

GiAPA Insight Reporting

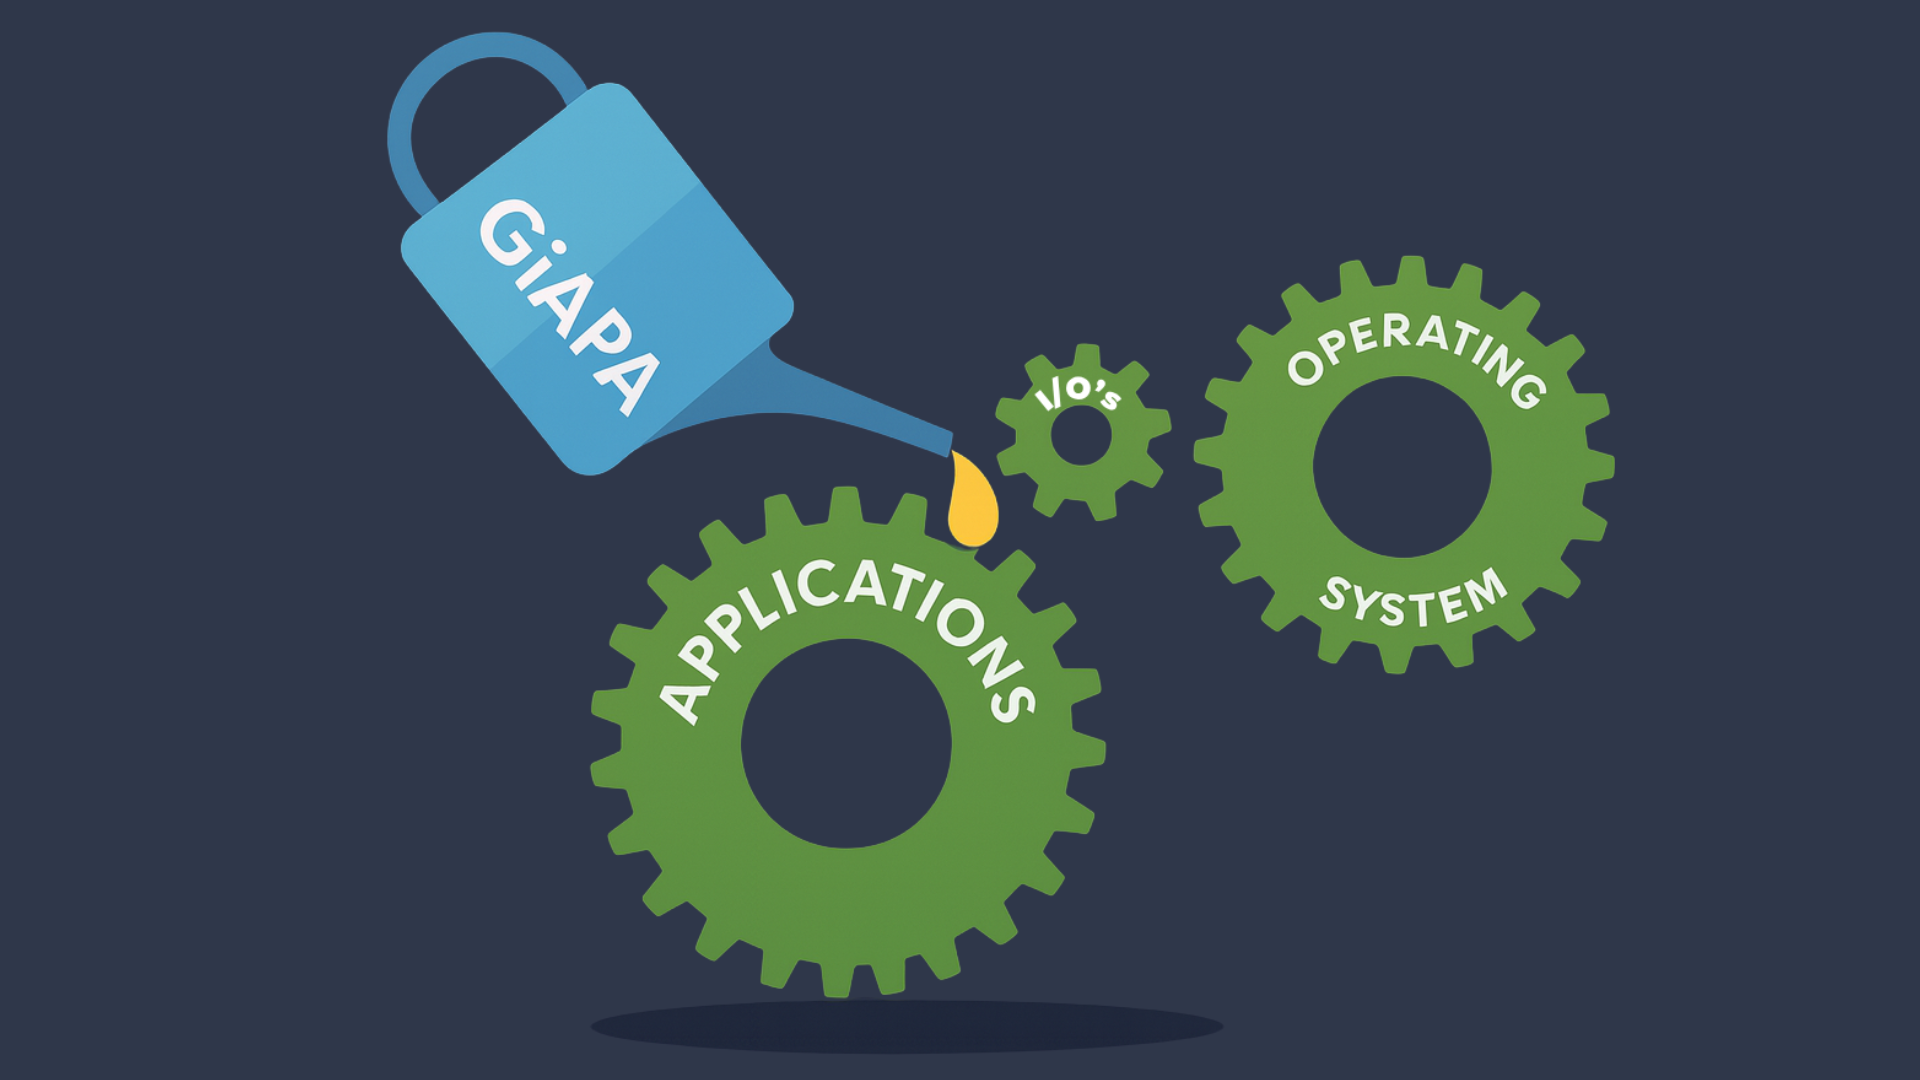
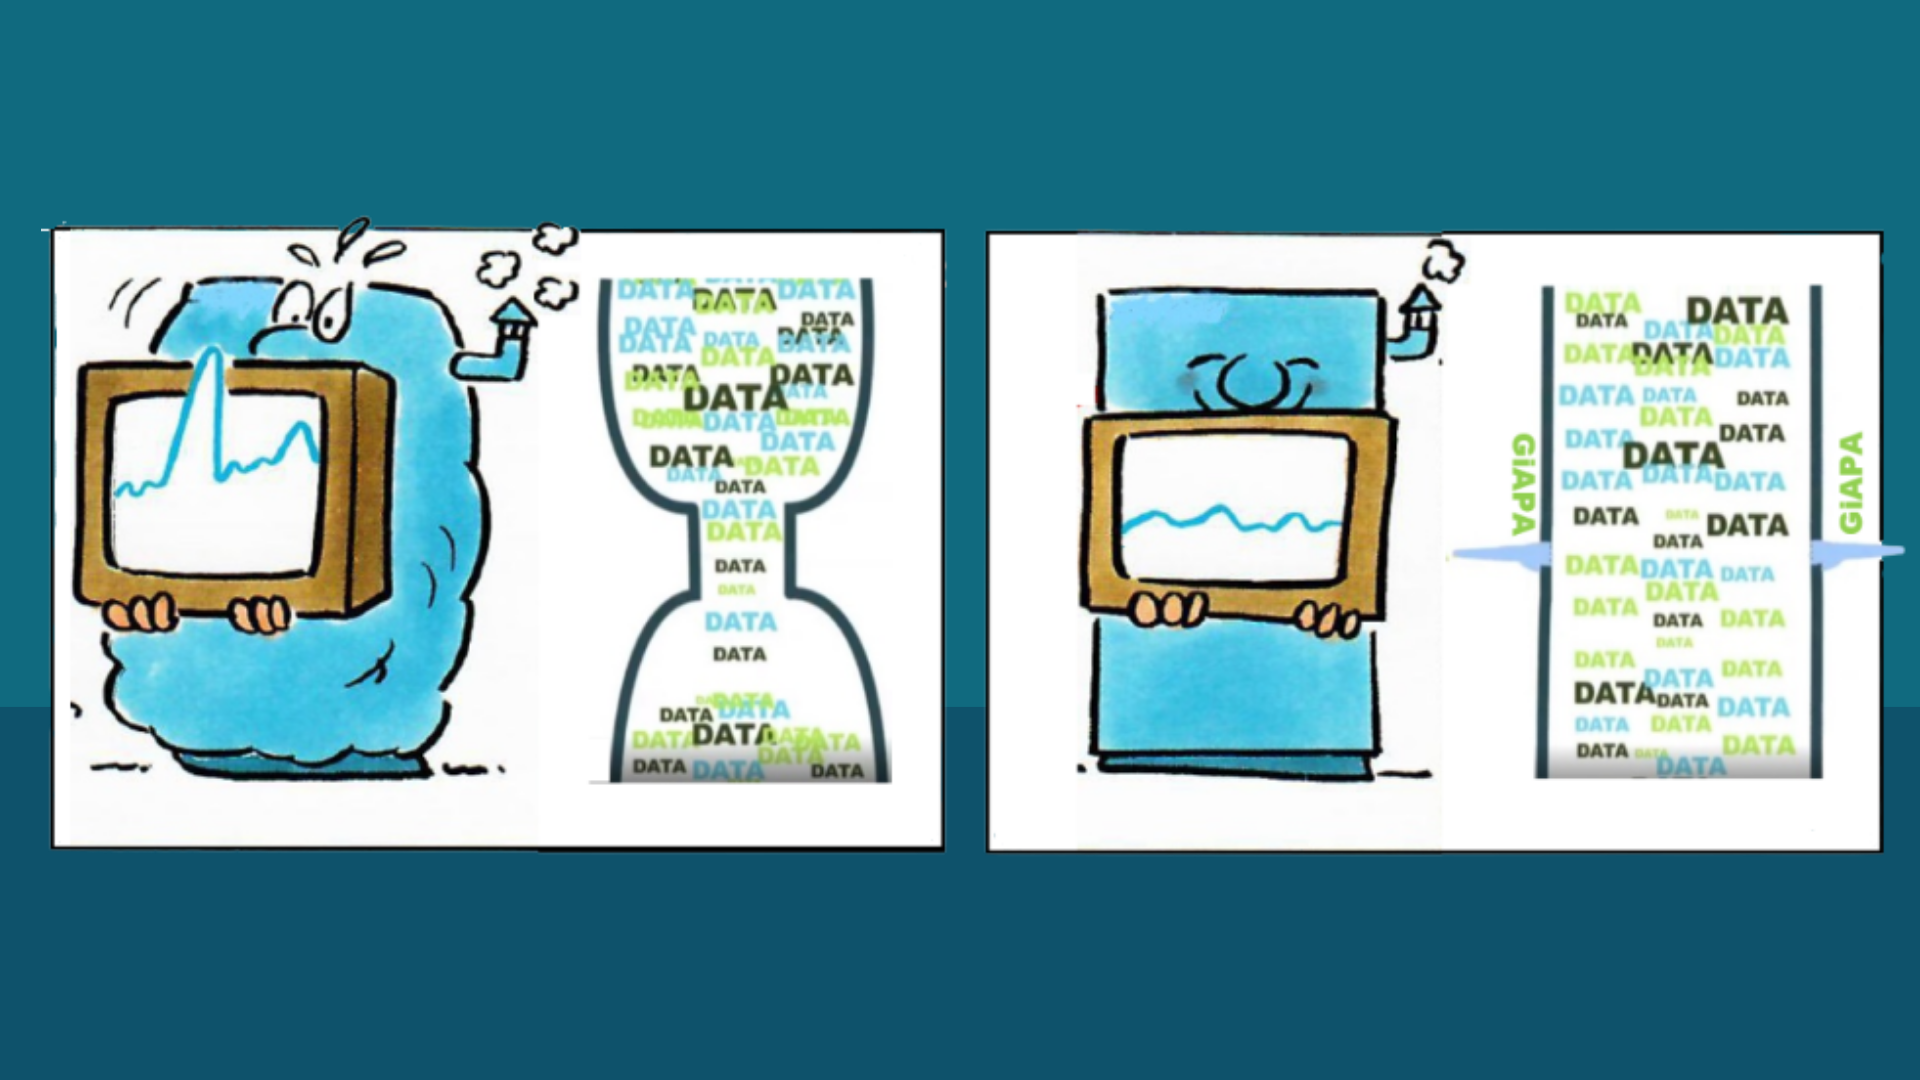
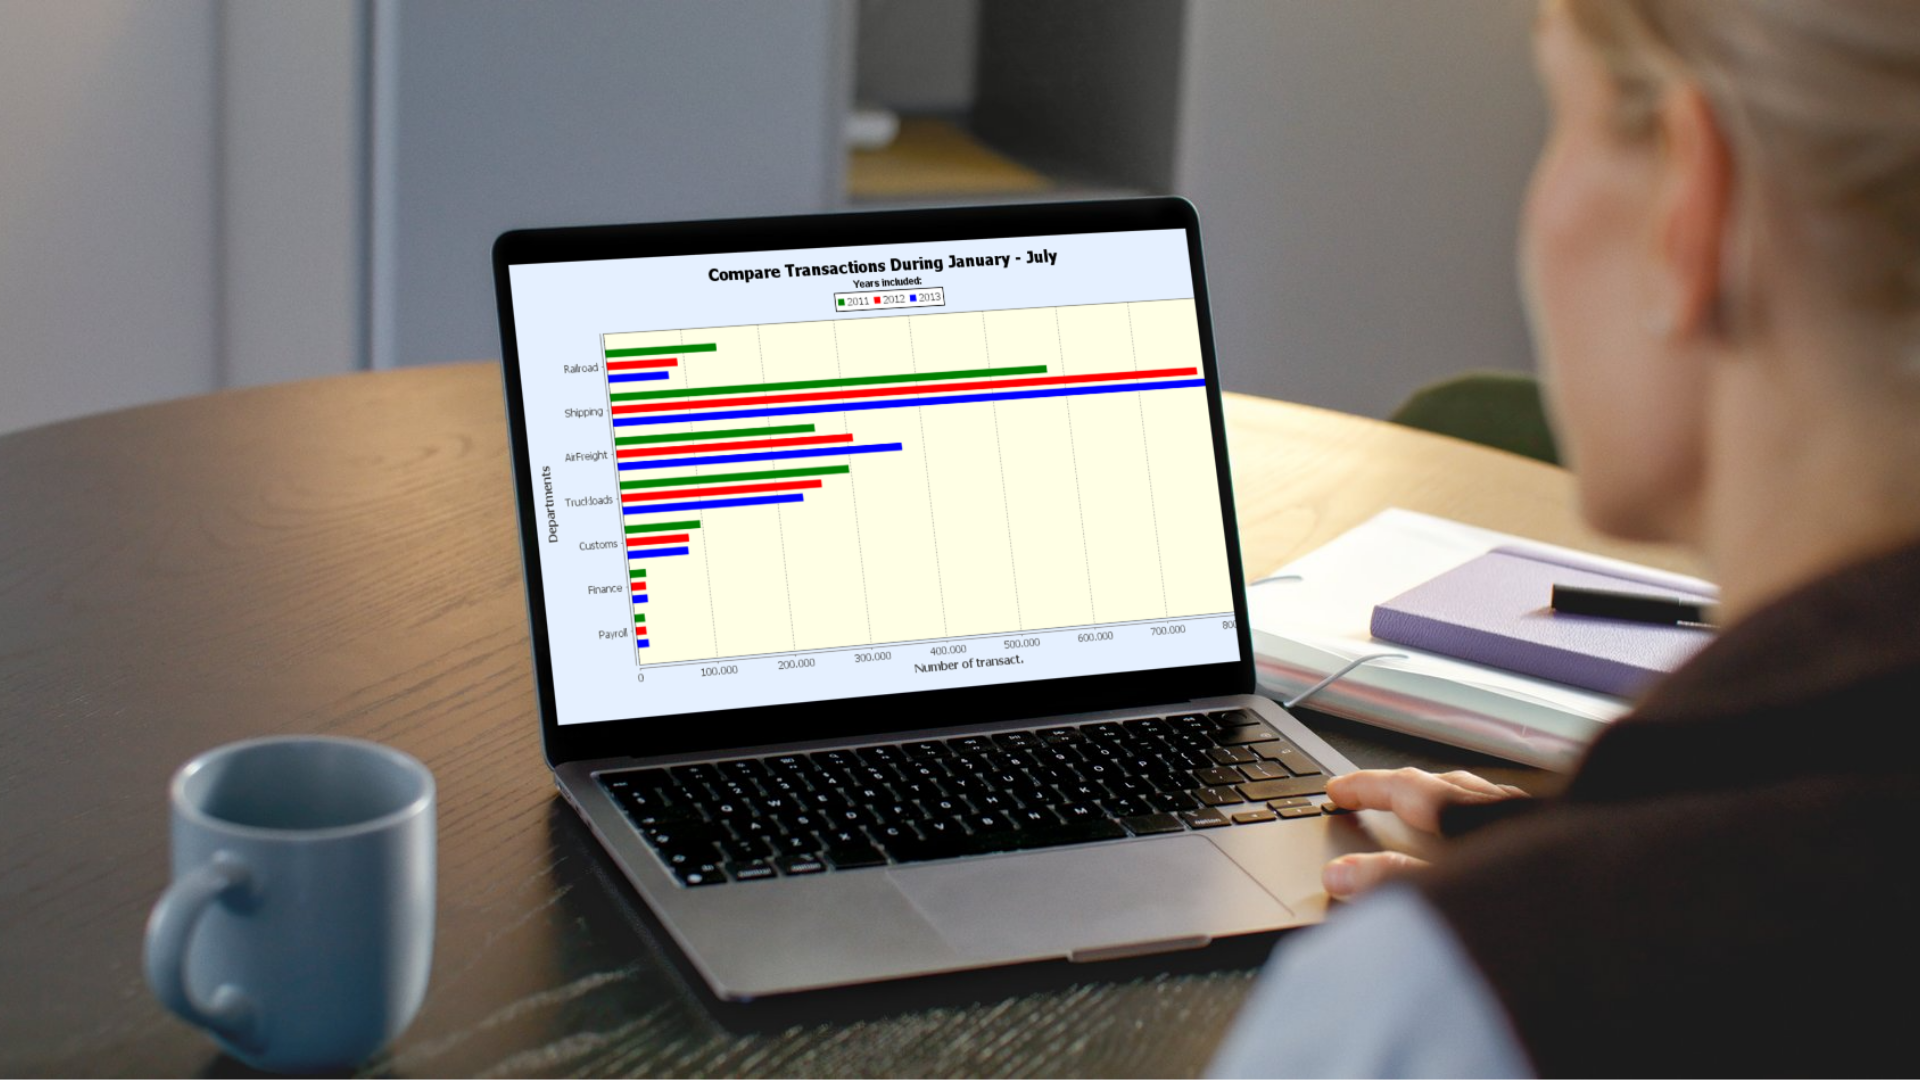
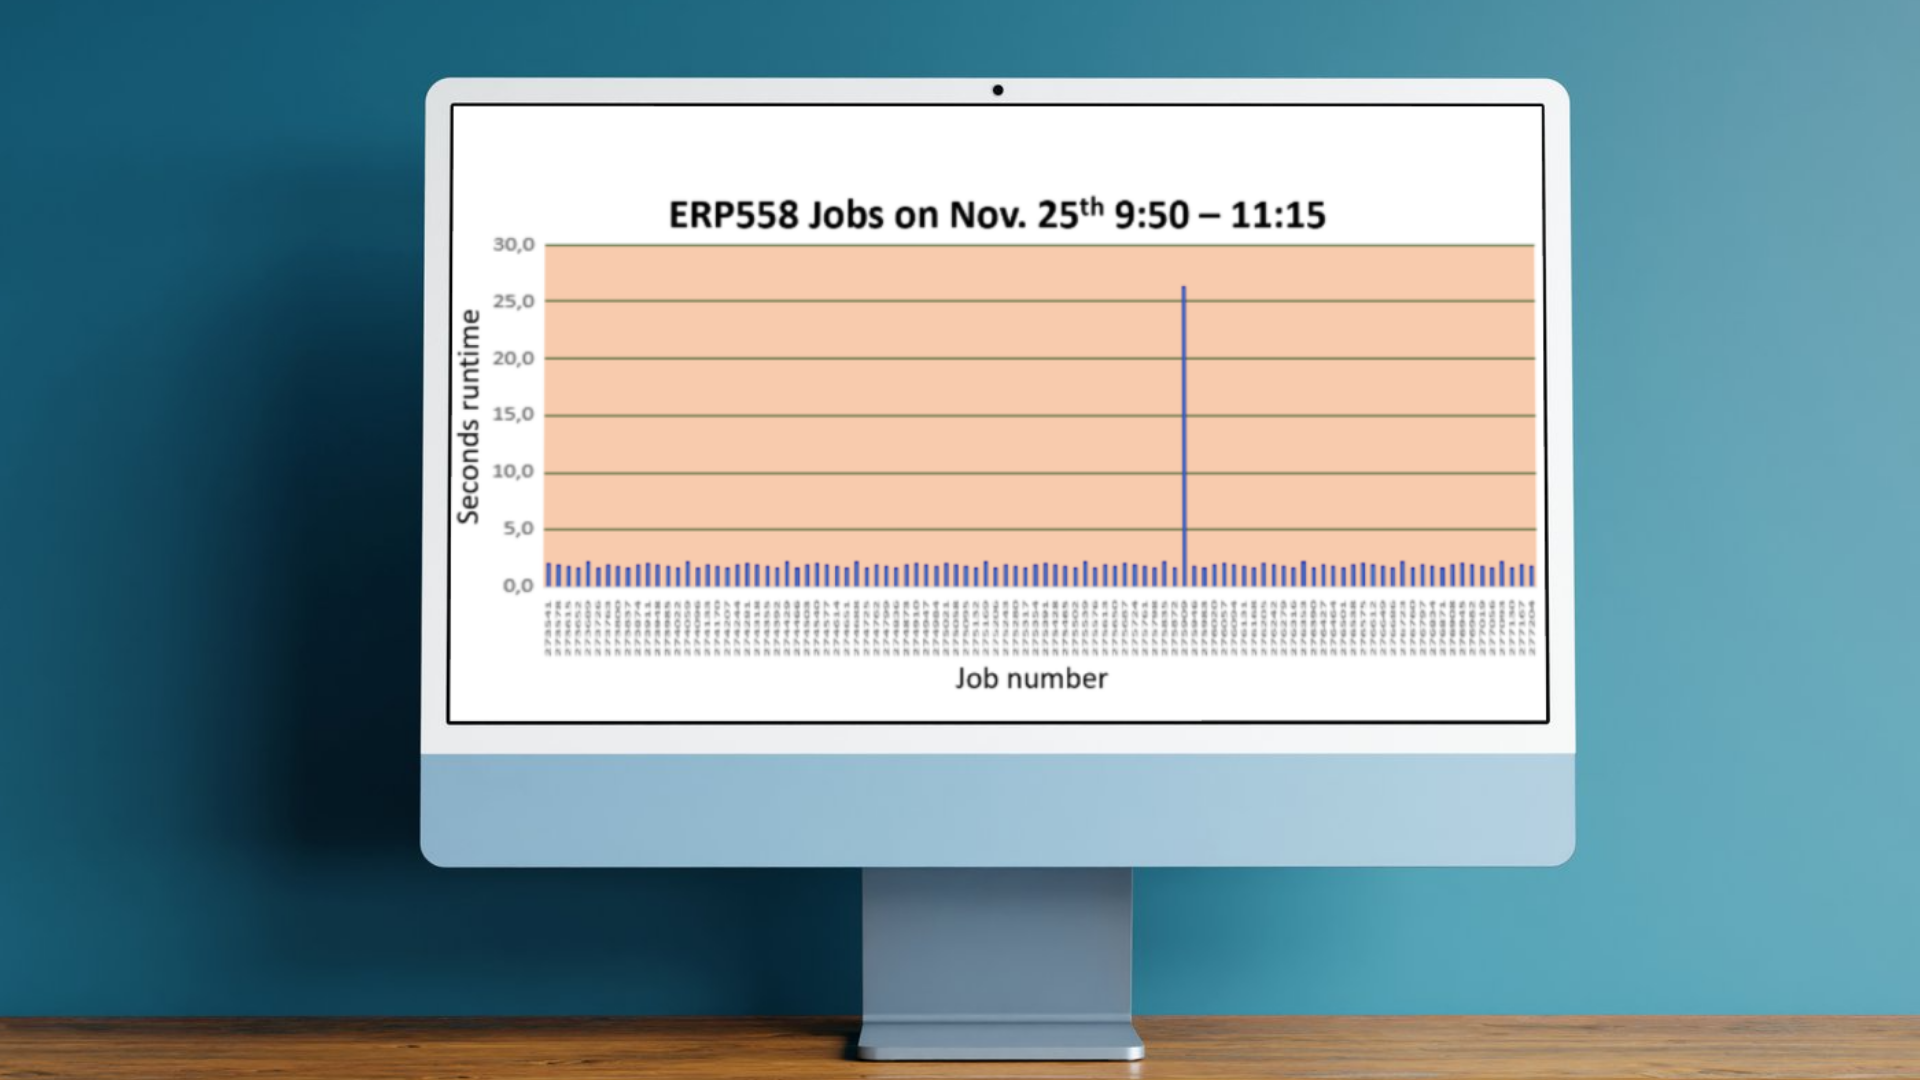
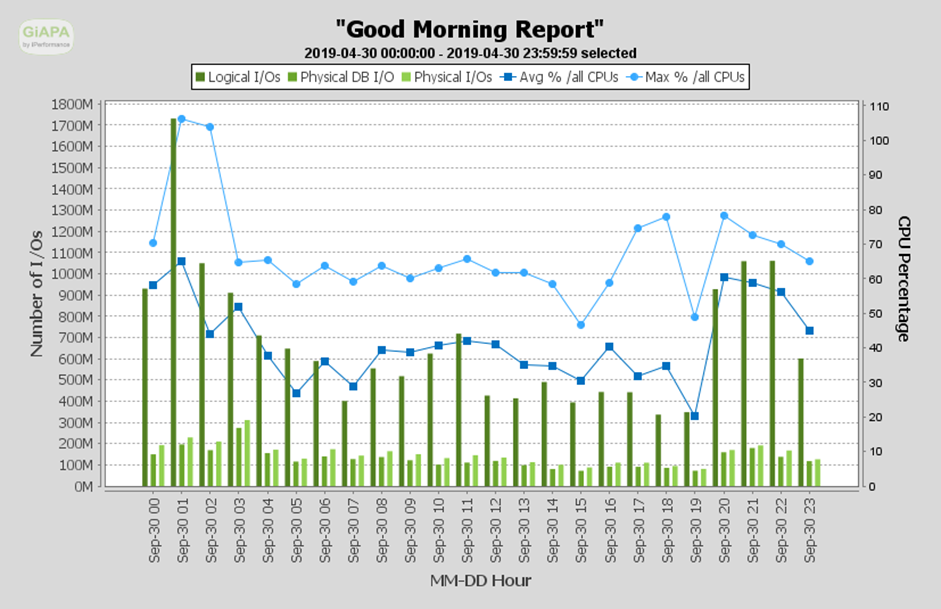
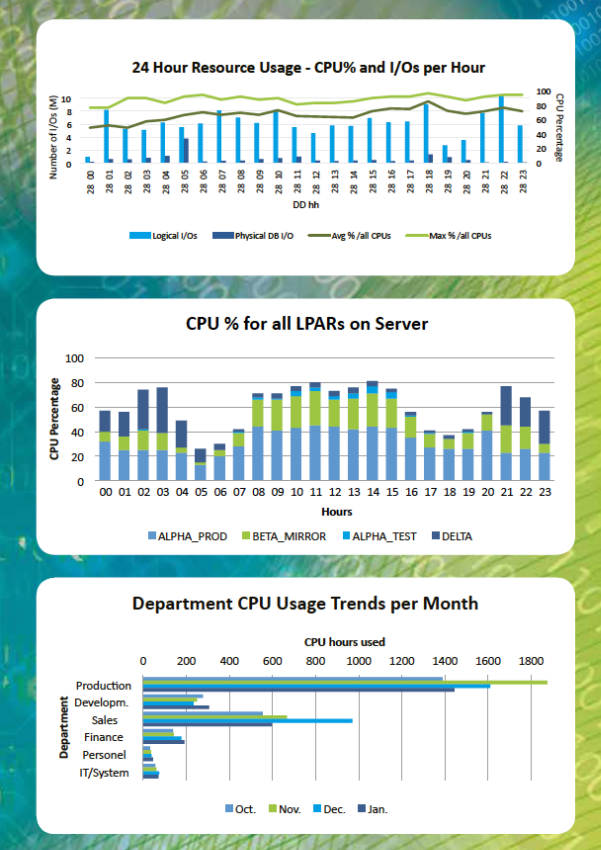
Turning complex performance data into clear insights.
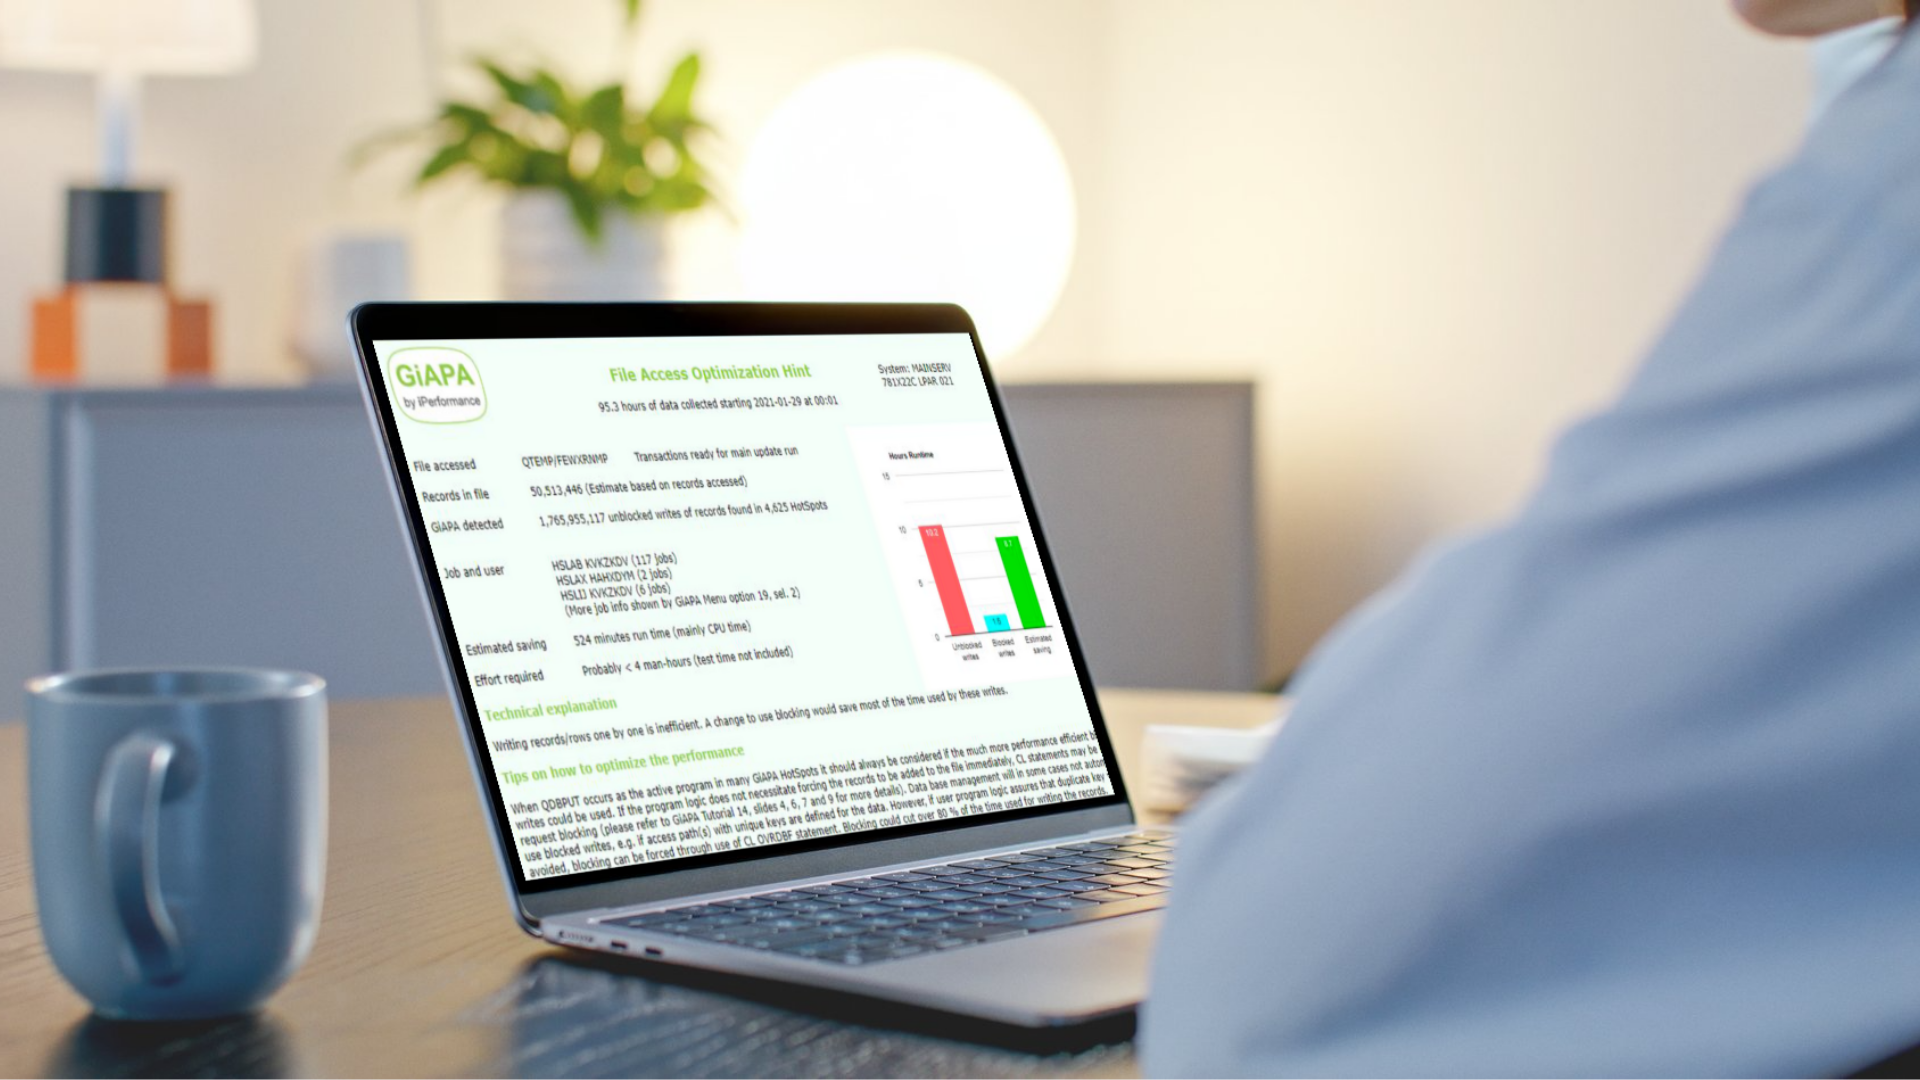
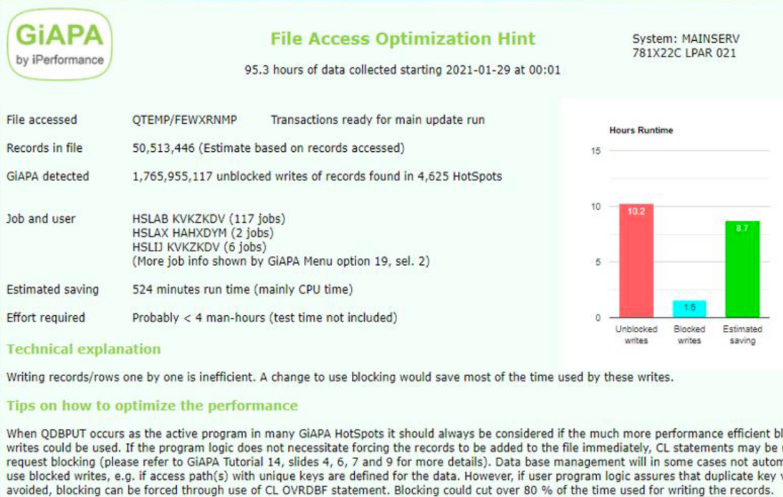
See for all jobs how much and which resources were used.

For CPU hogs, additional data documenting the actual activity is collected.
This allows pinpointing optimization potential down to source code line number.

Deep system visibility

Detect trends in CPU and memory  usage, and physical / logical I/Os over time.
Spot anomalies and patterns before they affect your users.
  • checkicon
    CPU load
  • checkicon
    Memory usage
  • checkicon
    Disk I/Os
  • checkicon
    Logical I/Os
dashboardimageimage

Performance Analytics

Stay in control with insights from your IBM i LPAR's.
GiAPA visualizes not only resource usage,
but also what the resource were used for.
dashboardavarage imageprofit imagethis image

Tailored Reports

Visualize exactly the data you need, from top jobs and users to SQL response times and system trends.
dashboardimageimage

Key features that make GiAPA stand out

Minimal performance load <=> Can run 24/7
Quick Setup
Performance Insight Reports
IBM i Application Analysis
No Configuration
Runs under IBM i
feature shape
  • feature icon

    GiAPA runs out of the box using
    < 0,1% CPU.

  • feature icon

    Start collecting performance data in minutes. Just download and start collecting data every 15 seconds.

  • feature icon

    Visualize what matters most to you. Adjust filters and views. Focus on jobs, SQL, users or system resources.

feature imageanaylytics imagedashboard  image
sales imagesales dash image

The Power of GiAPA Insights

GiAPA doesn't just collect data...
sales icon

GiAPA shows you exactly where to optimize your IBM i applications

sales icon

GiAPA estimates how much runtime can be saved

sales icon

GiAPA estimates how much effort is needed to fix the problem


GiAPA
is trusted by IBM i professionals across industries.

GiAPA

What the users say

card image
«GiAPA has been a game-changer for resolving our performance challenges. We have improved our customer service... and have a much better ROI on our IBM i.

GiAPA has helped us focus on the actual performance issues instead of 'flying blind'.
Brian Kelly, Technical Director, Vermont Information Processing
Manufacturing Sector

Use GiAPA alongside your existing IBM i tools

GiAPA runs independently and doesn’t interfere with other software.

Export reports, share insights and combine with your current workflow to prioritize your optimization tasks.
Learn more
brand integration image

Performance Insights

In this section, you'll find in-depth articles, practical tips, and real-world experiences aimed at helping system administrators and IT decision-makers improve performance, reduce resource usage, and get more value from their IBM i environments. Whether you're exploring general best practices or diving into specific GiAPA capabilities, our insights are here to guide you. Explore, learn, and optimize.